|
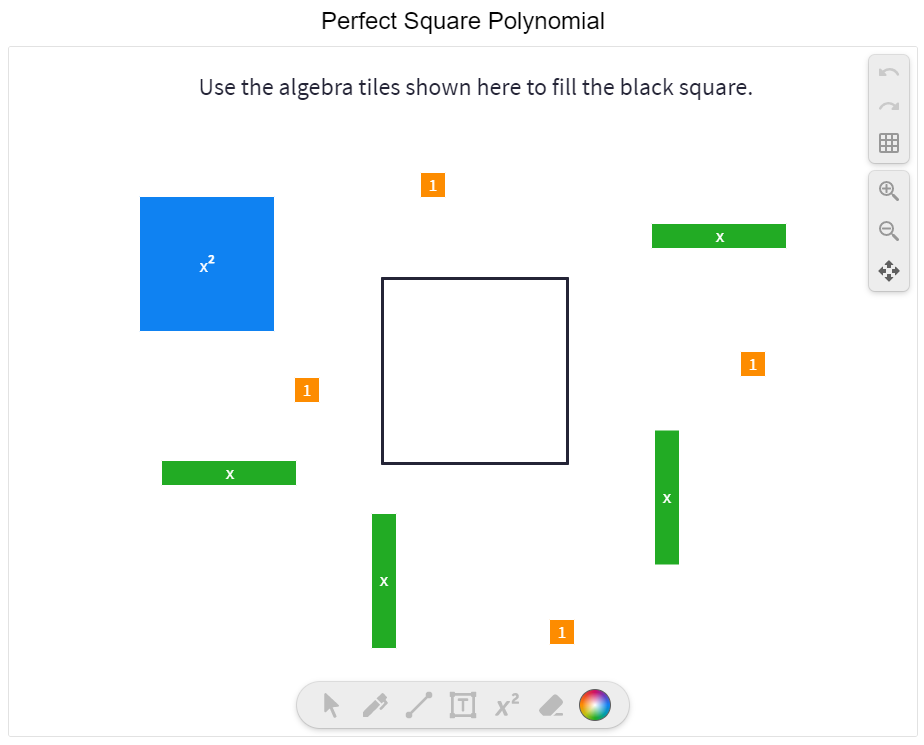
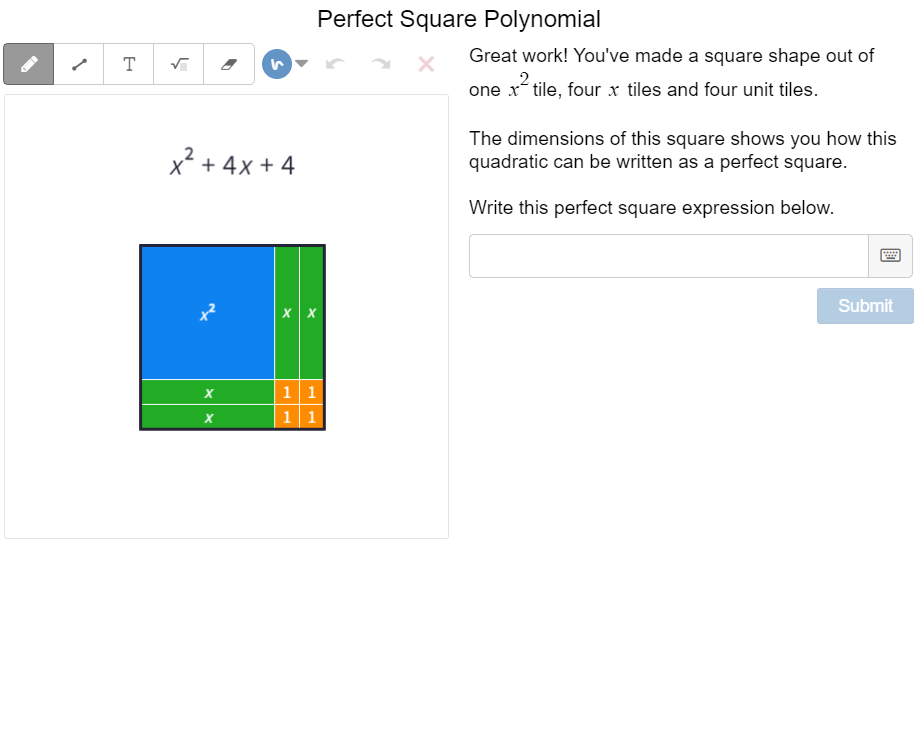
One of my favorite recent technology tools has been the ability to incorporate Mathigon Polypad screens into a Desmos classroom activity. Last week I had the opportunity to work with a high school class learning to change from standard form to vertex form of a quadratic using completing the square. I thought this would be a great opportunity use virtual algebra tiles in a Desmos activity. Students at this school have had lots of experience using physical algebra tiles in previous grades so these students were already familiar with the manipulative. 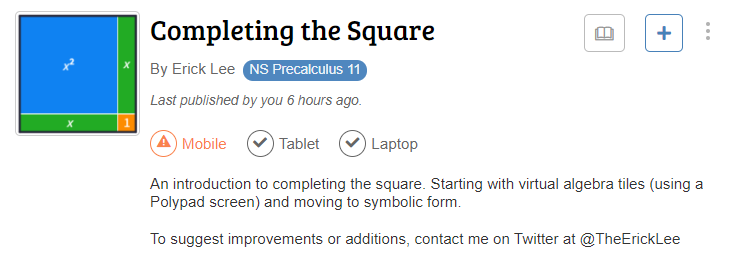 https://teacher.desmos.com/activitybuilder/custom/63f51763f720e0a8e00e5341 The activity starts out with a review of perfect square numbers and then shows how these relate to perfect square polynomials. Then we moved to using virtual algebra tiles in Polypad to model perfect square polynomials. From there we progressed slowly towards completing the square.
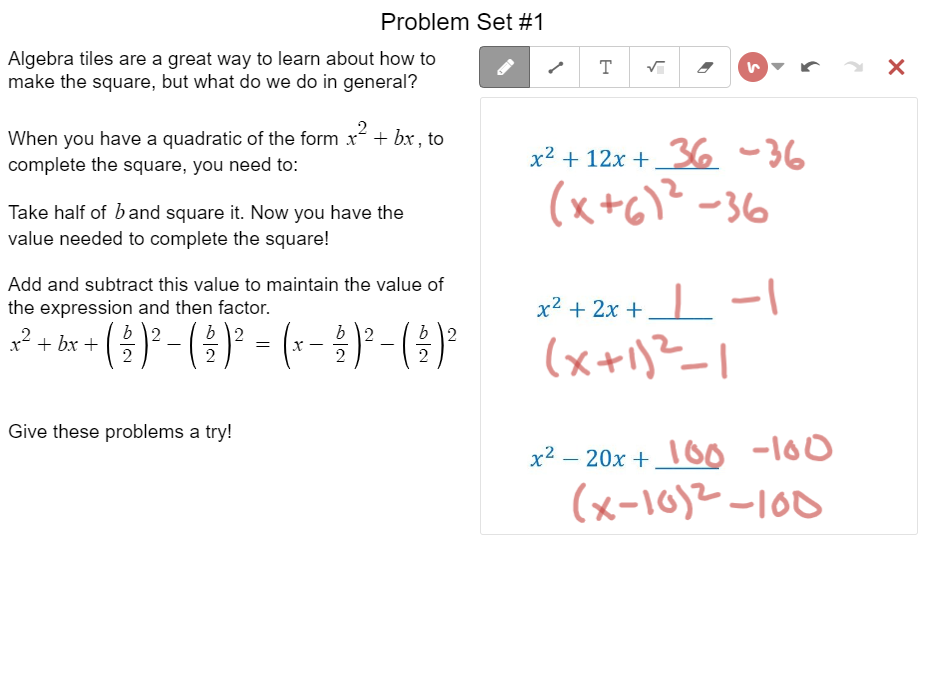
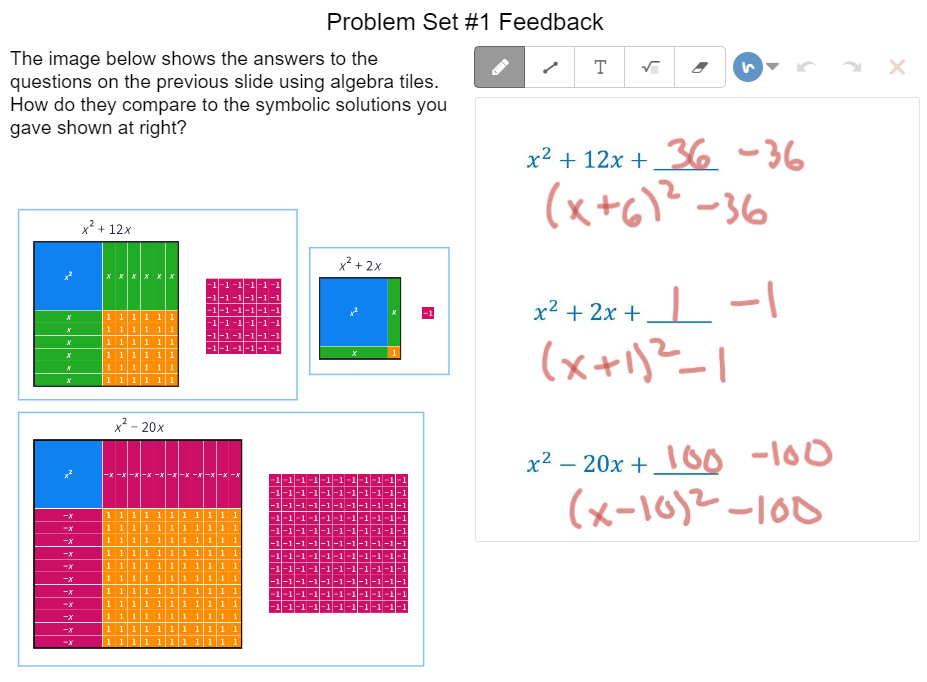
Once we built up to generalizing the process of completing the square, students had an opportunity to practice this skill. Instead of giving them feedback on the correctness of their answers, I was able to give them pictures of the algebra tile representation to compare their answers to. I think this helped students reflect on their answers instead of just looking for a green checkmark. I used the pacing tool to make sure most students had finished the question before moving to check their work on the feedback slide.
Desmos had an amazing guide to help teachers reflect on the activities they've created. It is called "The Desmos Guide to Building Great (Digital) Math Activities v2.0". I encourage everyone to check it out. Students seemed to enjoy this Desmos activity and the dashboard allowed me to provide targeted support to the few students that appeared to be struggling. After this we did some additional practice and consolidation using a completing the square fill in the blanks sheet from Dr. Austin Maths (a great site for a variety of practice resources). Nova Scotia Mathematics Curriculum Outcomes Precalculus 11 RF04 - Students will be expected to analyze quadratic functions of the form y = ax² + bx + c to identify characteristics of the corresponding graph, including vertex, domain and range, direction of opening, axis of symmetry, x-intercept and y-intercept, and to solve problems.
EL
Investigations where students discover the relationship between variables can help students build a deeper understanding of functions. Often these explorations are hands on and engaging lessons. They typically start with some sort of interesting video or question prompt such as "What makes for an exciting bungee jump?" or "Which cup will keep my coffee warm the longest?". I was prompted to think about my favourite investigations after seeing a post from Nat Banting on Twitter. Below are a collection of links and descriptions of my favourite secondary mathematics investigations. Linear Relationships
Quadratic Relationships
Exponential Relationships
I like the investigation above because they share several common features.
Do you have a favourite activity or resource for activities? Please let me know what it is. EL
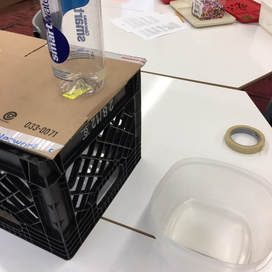
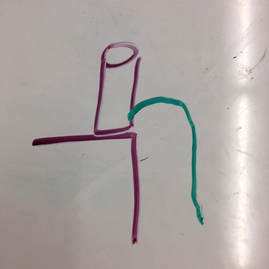
I recently had the opportunity to work with a student to investigate parabolas and quadratic functions. We used one activity to investigate two different quadratic relationships. First we observed the shape of the stream of water coming out the side of a water bottle and then we observed the rate the water drains. The Water FountainI set up a cylindrical bottle of water on a crate. The bottle had a whole in it covered with a piece of tape. I asked students for some predictions. What will the shape of the water coming out of the side of the water bottle look like. What will happens to the stream of water as the water level goes down?
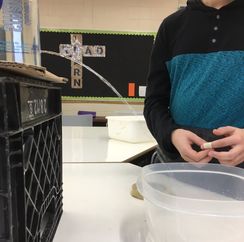
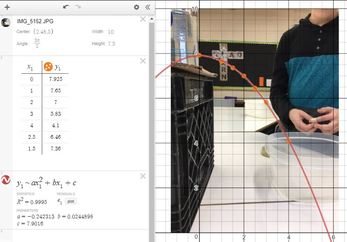
I noticed that the student drew the water stream coming out of the bottle like it comes out of a water fountain (where we had just filled the bottle). We took the tape off the hole and then watched the water come out while making some observations and taking some photos. We selected a good photo (the black bulletin board in the background really helped) and loaded into Desmos. Then we used a table to record some points along the steam of water. After that we did a linear and then a quadratic regression on the point to see that the parabola was a much better fit than a line. We then had a chat about parabolas and projectile motion.
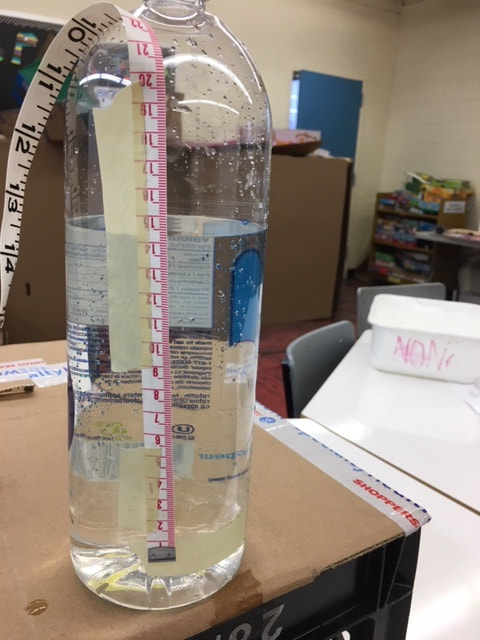
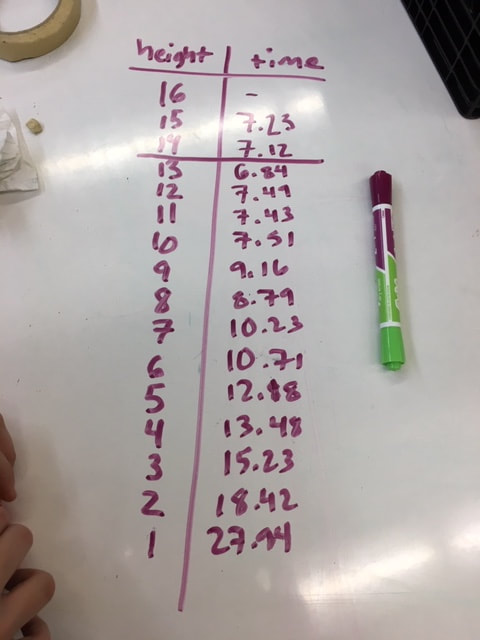
Draining the TankWe set up the water bottle again but this time instead of looking at the shape of the stream of water, we focused on how fast the water level fell. I asked the student to predict what this might look like. You might ask students to predict what a graph of the water level might look like over time for the two situations below. How would the graph look when filling the tank compared to emptying the tank? 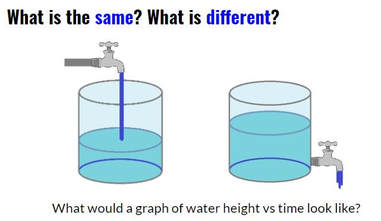 The water flowing into a tank should rise at a linear rate. Students should expect that when the water drains from an open tank, the flow will be greatest at first and then gradually decrease as the water level decreases. (This is an application of Torricelli's Law). Next we taped a measuring tape to the side of the bottle and collected some data as the water flowed out of the bottle (A similar experiment is described in Canavan-McGrath, Foundations of Mathematics 12, 429). We used the stopwatch on my cell phone to record the time at each centimeter of height. This wasn't as accurate as I had hoped due to some distractions in the room. We set up the experiment again and the second time I recorded the water falling using a video (I used the CoachMyVideo app). We were able to get much more accurate values this way.
We entered the data in a table on Desmos and then did a quadratic regression to fit a curve to our points. I was a bit surprised at how well the data from the video analysis on our second attempt fit to a quadratic curve (R^2 = 0.9999. 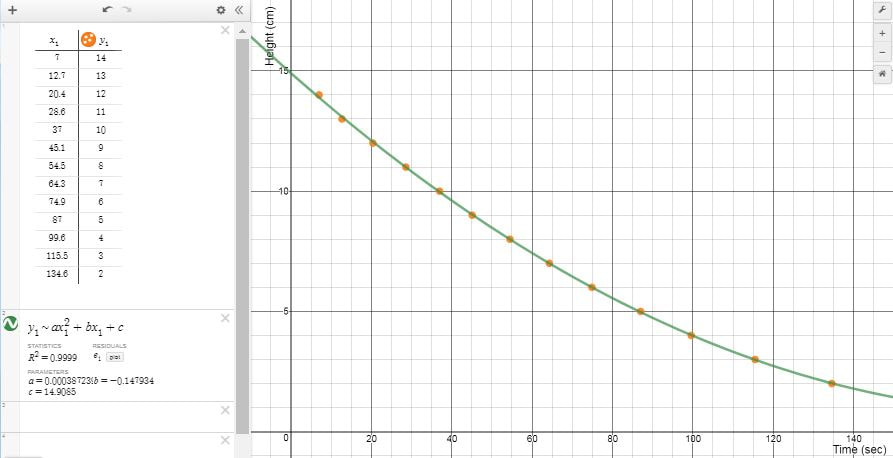 I really liked how we could use the exact same setup to investigate two different quadratic relationships. Nova Scotia Mathematics Curriculum Outcomes Mathematics 11 RF02 - Demonstrate an understanding of the characteristics of quadratic functions, including: vertex, intercepts, domain and range and the axis of symmetry. Pre-calculus 11 RF04 - Students will be expected to analyze quadratic functions of the form y = ax^2 + bx + c to identify characteristics of the corresponding graph, including vertex, domain and range, direction of opening, axis of symmetry, x-intercept and y-intercept, and to solve problems. EL
|
Categories
All
|
 RSS Feed