|
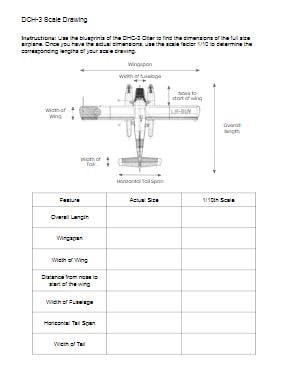
Students work with scale in a number of mathematics courses in Nova Scotia. In the Mathematics Essentials 12 course, they work with scale in conjunction with reading blueprints. This scale activity uses the blueprints for an iconic Canadian airplane, the DHC-3 Otter. I started the lesson with some estimation. 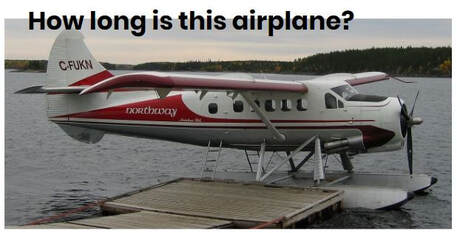 I didn't let students know the name of the airplane to start with so that they don't just Google the name of the airplane and find out the actual length. Instead they use clues from the photo to make an estimate. Some references might include the size of the dock or ramp, the height of the wing, or the size of the windows or door. We use a routine I learned from Estimation180 to ask for an estimate they know is too low, an estimate they know is too high and then a just right estimate. After everyone had made and estimate, I showed them an image from a blueprint and asked them if they'd like to revise their estimate using some additional information. 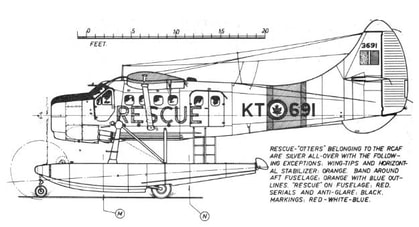 On the blueprint, they can see a scale drawn above the plane. Students use this information to either confirm or adjust their estimate. We can then use the scale to measure the image to find out the actual length of the plane (about 41 ft). After this opening activity, I showed them a picture of a 1/48 scale plastic model and ask them to tell me what the size of the finished model is knowing the size of the actual plane and the scale factor. The opening estimation allowed students a chance to think about scale. Next I handed out the blueprints for the plane. Our task was to use the blue prints to help create a 1/10th scale drawing of the top view of the plane using painters tape on the floor.
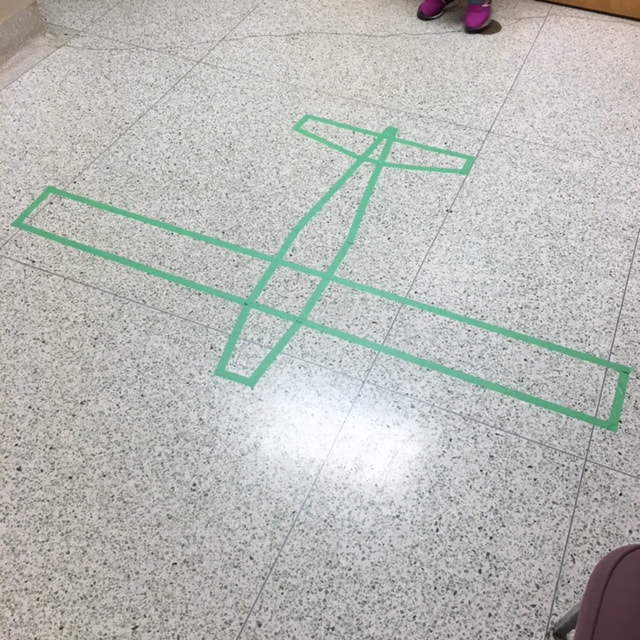
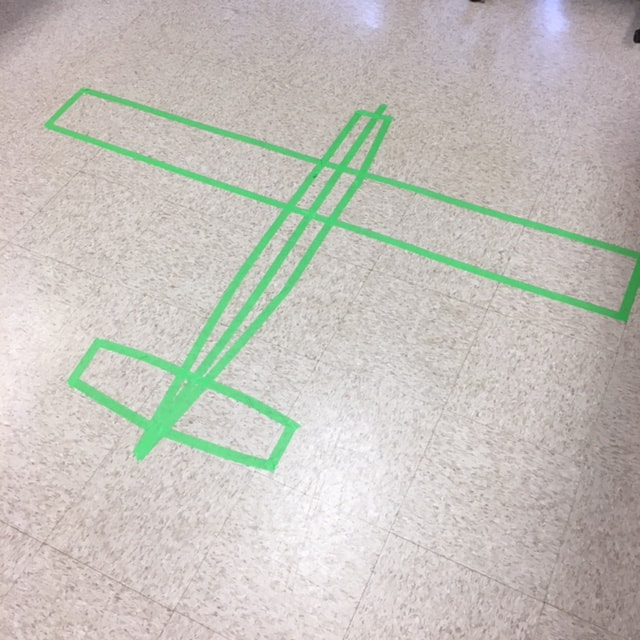
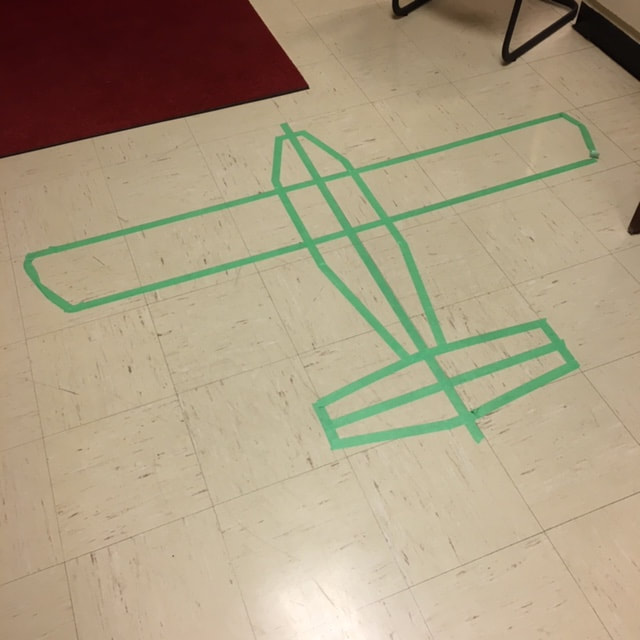
Students worked in small groups to recorded their measurements and calculate the measurements for the scale drawing. Once they were finished each group was provided with some painters tape and measuring tapes in order to make their scale drawing on the floor. It could be nice to have one group do their drawing on the wall, then it could stay up as a reference to their work with scale. We also talked about writing their measurements on the painters tape as they put it down. Variations and ExtensionsStudents who finish quickly can continue to add additional details such as the pontoons. This activity could also be done with larger groups creating a life size drawing of this plan using sidewalk chalk outside (weather permitting). NS Outcomes:
Mathematics Essentials 12 - 3.1 Calculate the dimensions of actual objects using blueprints with various scales Mathematics 11 - M02 Solve problems that involve scale diagrams, using proportional reasoning Mathematic at Work 11 - G02 Students will be expected to solve problems that involve scale; and G04 Students will be expected to draw and describe exploded views, component parts and scale diagrams of simple 3‑D objects. Mathematics Essentials 11 - E4 create 2-D scale diagrams and 3-D scale models Mathematics 9 - G03 Students will be expected to draw and interpret scale diagrams of 2-D shapes. I was recently looking for an activity to explore a linear relationship, preferable one that included some practice with decimals. I found a few examples but none of them really seemed to satisfy what I was looking for. Here are a few of my criteria for good experiments to explore function relationships:
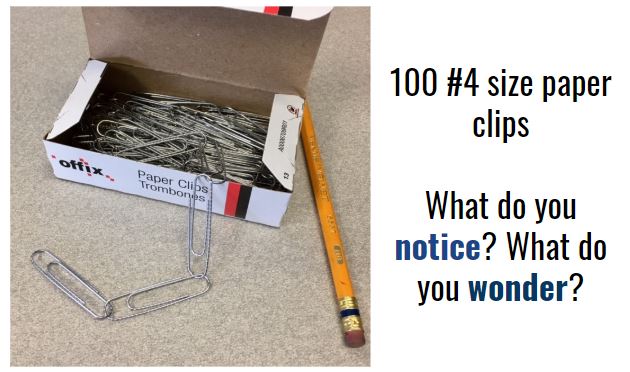
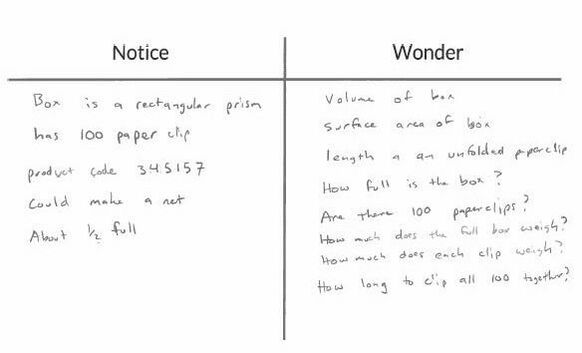
Notice and Wonder
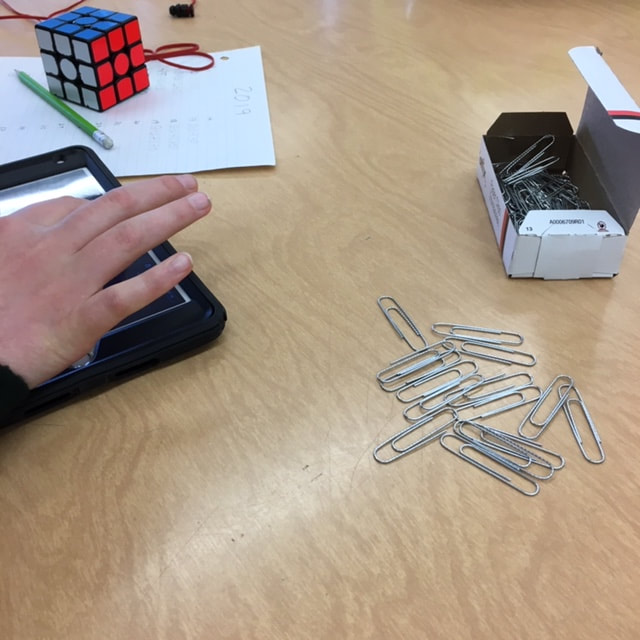
There were some great questions about volume and surface area, weight, and size of the paper clips (what is a #4 sized paper clip?). The questions the we went on to investigate was how long would it take to make a paper clip chain from all 100 paper clips. I was inspired by Dan Meyer's Guinness World Record for the longest paperclip chain in 24 hours. Dan blogged about breaking the record as well as asking student to see how many paperclips they could chain in one minute. Estimation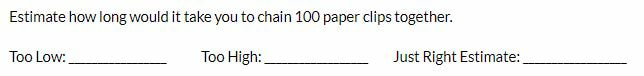 I asked students to estimate how long they thought it would take to create a chain of 100 paper clips. I also asked them to think about an estimate that they know was too low (that creating a chain this fast was not possible) and too high (that they would have no problem creating a chain in this time even going slowly). Most students thought that a time between 5 and 6 minutes was a good "just right" estimate. Gathering Data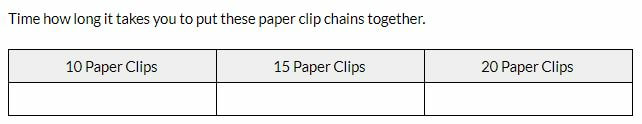
Revising EstimatesAfter collecting and analyzing some data, I ask students if they'd like to revise their estimate for 100 paper clips. Then we test their revised estimate using a plot of the values they collected and extrapolating. Below is one student's data plotted in Desmos. They estimated 300 seconds (5 minutes) to chain all 100 paperclips. 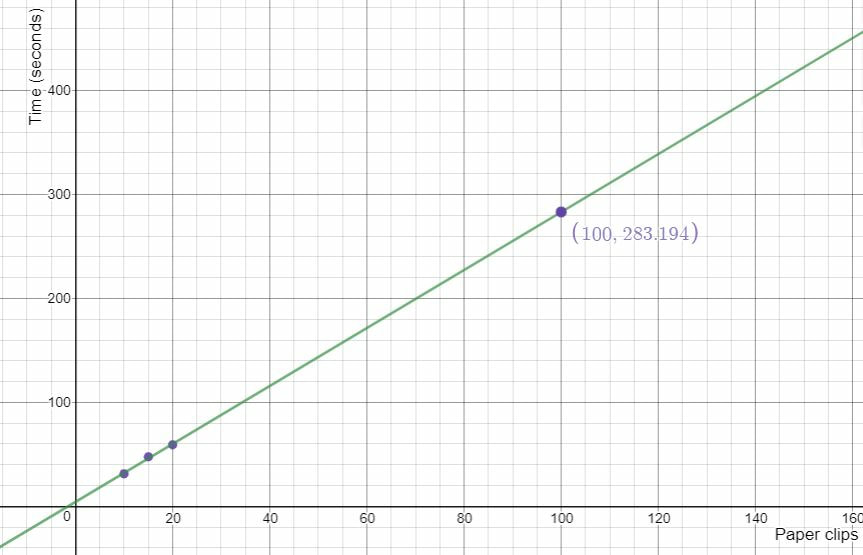 This lesson could be modified to include outcomes from a number of different grade levels. I closed the lesson by showing students the record for the most paper clips linked together in one minute and asked students how they would compare. Nova Scotia Mathematics Curriculum Outcomes Mathematics 6 SP01 - Students will be expected to create, label, and interpret line graphs to draw conclusions. Mathematics 6 SP02 - Students will be expected to select, justify, and use appropriate methods of collecting data, including questionnaires, experiments, databases, and electronic media. Mathematics 6 SP03 - Students will be expected to graph collected data and analyze the graph to solve problems. Mathematics 7 PR02 - Students will be expected to create a table of values from a linear relation, graph the table of values, and analyze the graph to draw conclusions and solve problems. Mathematics 7 N02 - Students will be expected to demonstrate an understanding of the addition, subtraction, multiplication and division of decimals to solve problems (for more than one-digit divisors or more than two-digit multipliers, the use of technology is expected). Mathematics 7 SP01 - Students will be expected to demonstrate an understanding of central tendency and range by: determining the measures of central tendency (mean, median, mode) and range; determining the most appropriate measures of central tendency to report findings. Mathematics 7 SP02 - Students will be expected to determine the effect on the mean, median, and mode when an outlier is included in a data set. EL
This blog post could easily have been titled, "A Long Wait in a Really Long Line" but I like to be positive. I focus on the silver lining instead of the grey cloud. That's why I took a wait in a long long as an opportunity to practice estimation instead of a tedious and boring waste of time. 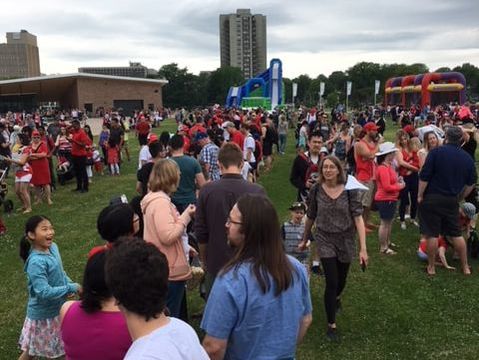 At the back of the line - 12:06 pm I spent a sunny Canada Day afternoon at the Halifax Commons. I went with my family to watch the SkyHawks, the Canadian Armed Forces Parachute Team. After the SkyHawks finished their jumps, we headed to the end of a a really long line so that my son could take a turn on a giant inflatable slide. Instead of dwelling on the length of the wait, we decided to focus on some fun estimation questions. How many people do you think are in this line? My son says he thinks it's more than 100 and I agree. How long will it take to get to the front of the line? I feel like we're in for a long wait. My initial estimate is at least 30 minutes. (Note: in order to answer this last question, I took a look at my watch to check the time... 12:06 pm). 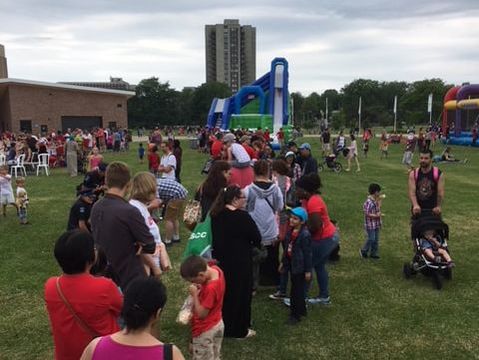 Slow progress - 12:27 pm Have we gotten any closer? It's 12:27 now (21 minutes in line) and it still feels like we've got a long way to go. There appears to be a strong correlation between the age of a child and the likelihood that they will have second thoughts at the top of the slide. This slows the line down dramatically as parents try to coax and cajole their child to make the leap. How many people in this line are kids waiting to slide and how many are parents/guardians? What is the average age of the kids going down the slide? 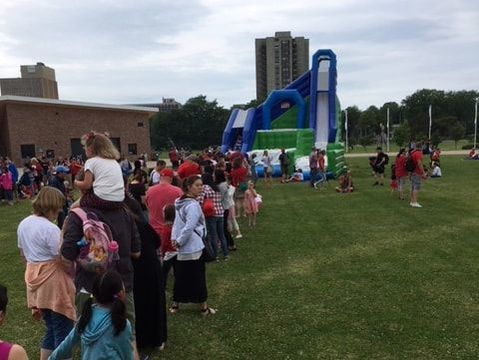 We're getting close now but this line is SO slow - 12:40 pm It's 12:40 now and we've been in line for over a half an hour. How many steps do you estimate their are to the top of the slide? I estimate that we're about half the distance to the slide from where we started. I realize that my initial estimate for how long we will be waiting was way off. At this point, I notice a group of upper elementary age students in front of us playing a hand clapping game called Concentration. After a bit, they shift to playing Chopsticks. This is a game I really like and I've used to introduce students to modular arithmetic so I watched their game to check out their strategy. It kept me entertained for a bit. 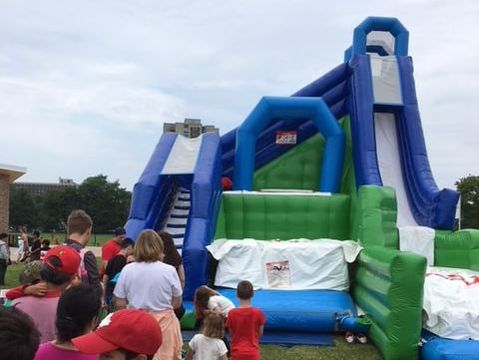 The sun is coming out and it's getting hot - 1:10 pm So close now I can taste it. It is 1:10 and we've been in line for over an hour. How tall do you estimate that slide is? I'd say it is about as tall as my house (a two story foursquare) which has a height of about 26 ft. (Note that the internet says this inflatable structure, called the 'Freestyle Combo', is 30 ft tall so my estimate seems pretty close). 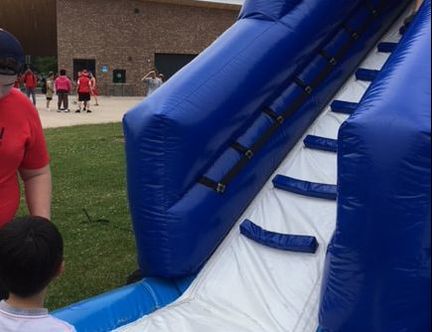 We made it! - 1:17 pm We finally make it! It is 1:17 pm and we stood in line for 71 minutes. My son seems to think that this was a reasonable investment for such an awesome slide but I have my doubts. At least we got to do a lot of estimation while we waited in line. We definitely won't be heading to the back of the line for a second slide. EL
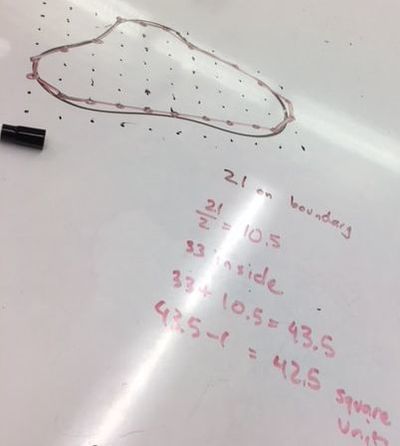
I prepared a lesson plan to work with a student. I carefully considered how I would introduce the topic, the path that the lesson might take and the questions that I would ask to prompt our discussion. I thought about the manipulatives that we might use to visualize and physically interact with the problem. I had a course carefully laid out. 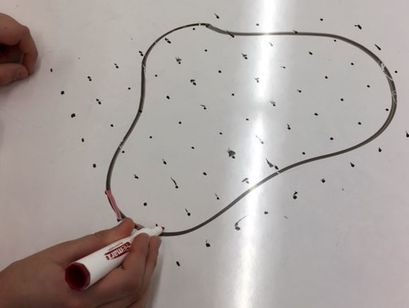 I started by drawing an irregular, kidney shaped area on the desk and asked the student how he would estimate the area of the shape. I was prepared for a number of different responses that I thought I might hear... but the student didn't follow my carefully plotted course for our lesson. Instead he replied, "I'd use Pick's Theorem." I grew up sailing on the Columbia River. When changing course on a sailboat, you can either turn the bow (the front of the boat) through the wind (i.e. tacking) or you can turn the stern (the back of the boat) through the wind (i.e. jibing). When tacking, the boom gently moves from from one side of the boat to the other. Jibing on the other hand can be dangerous as the boom suddenly jumps to the other side of the boat. When the student suggested Pick's Theorem, it felt like changing course by jibing instead of by tacking.
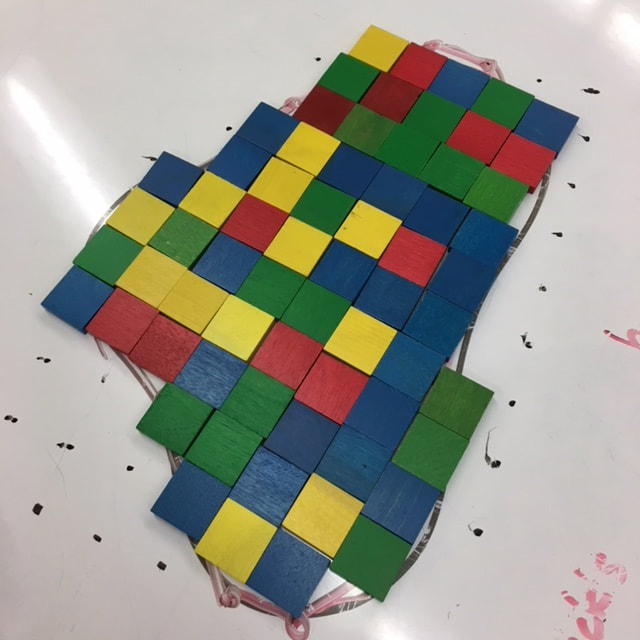
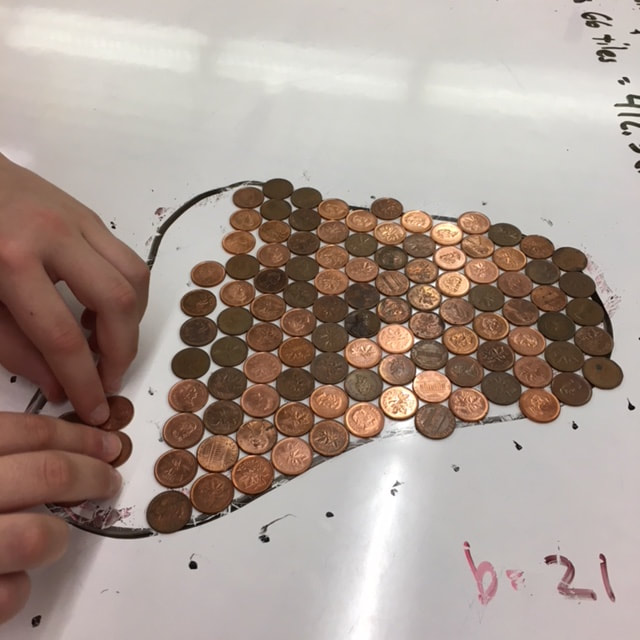
After our excursion through Pick's Theorem we found our way back to estimating the area with some manipulatives. First we covered the shape with square tiles and then we covered the shape with pennies.
We found that we could cover the shape with 66 square tiles. I asked the student how the area we found with Pick's Theorem and the area we found with square tiles compared. Through our discussion we decided that we needed a common way to talk about these areas so we converted both to square centimeters. We found that the area from Pick's Theorem was 382.5 cm^2 and the area using square tiles was 412.5 cm^2. Next, we looked at our penny solution. We looked up the diameter of a penny online and found that 135 pennies at 2.85 cm^2 each gave us a total area of 384.75 cm^2. While discussing how this estimate compared to our others, the student started talking about Alex Thue and his theorem on circle packing (this student has a really good memory). The student remembered that the efficiency of hexagonal packed pennies was about 91%. So we used this efficiency to correct our penny estimate to make it even better. This led to another discussion that I hadn't planned on about tesselations and polygons that tile the plane. The student said he had read in a book that there were 14 irregular pentagons that tile the plane. His book was a few years old however so he didn't know that a 15th pentagon had been discovered in 2015 or other recent work in this area. 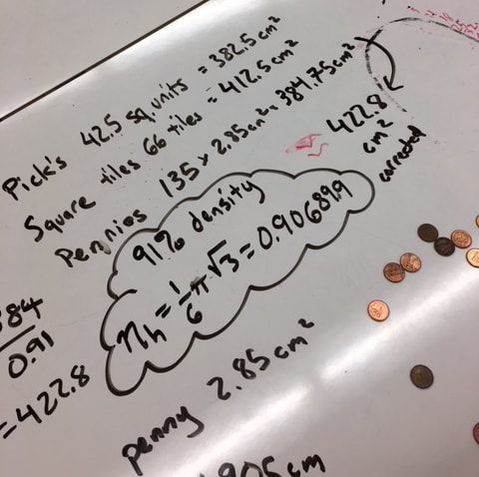 While the lesson didn't go quite as I had planned, I was really happy to be able to take the student's contributions to the discussion and weave them into the overall narrative of our work. Being flexible, listening to students and incorporating their contributions into a discussion can sometimes throw you off course and you might end up someplace unexpected. The journey along these altered courses however can be incredible. EL
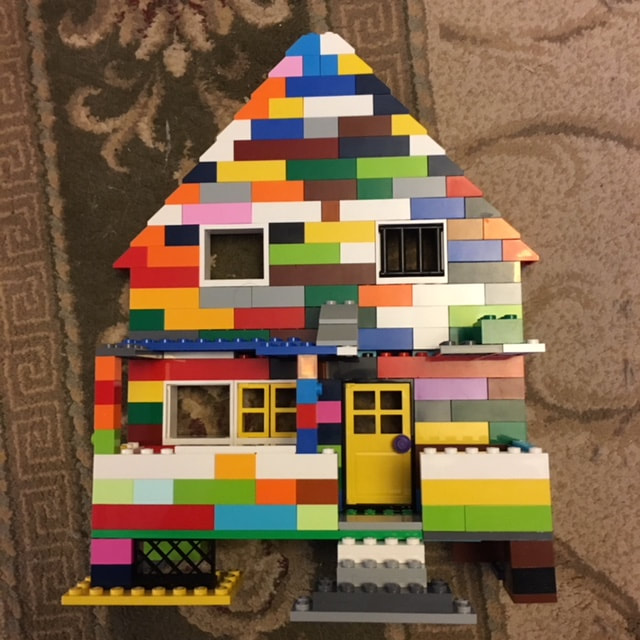
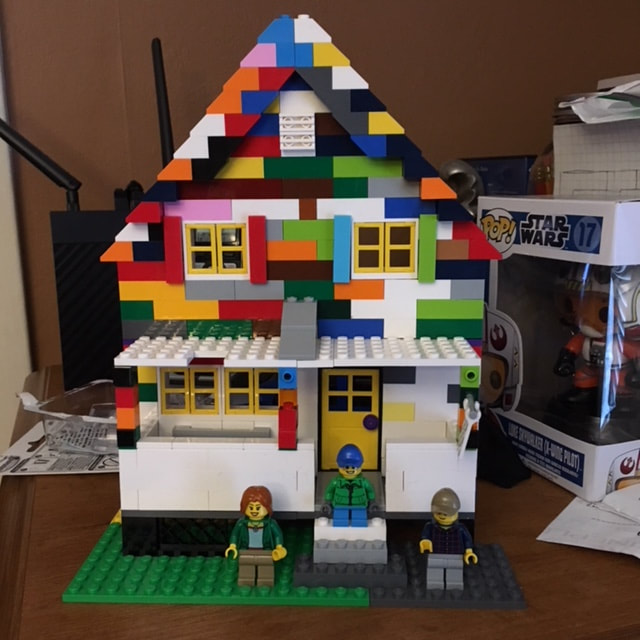
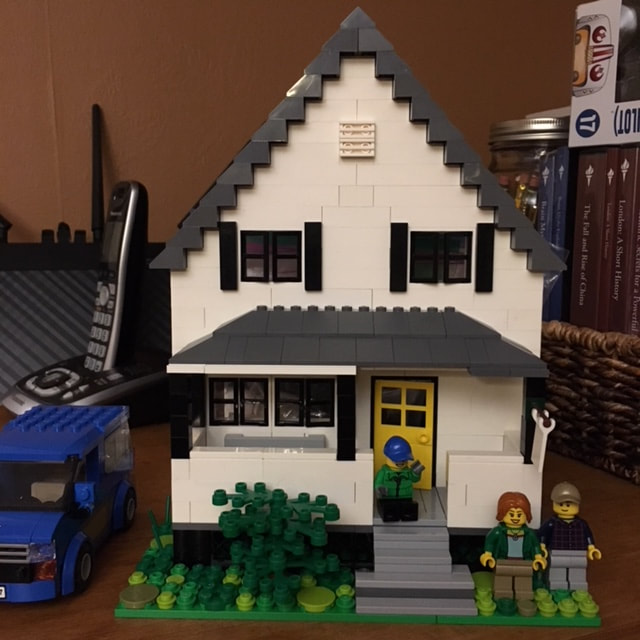
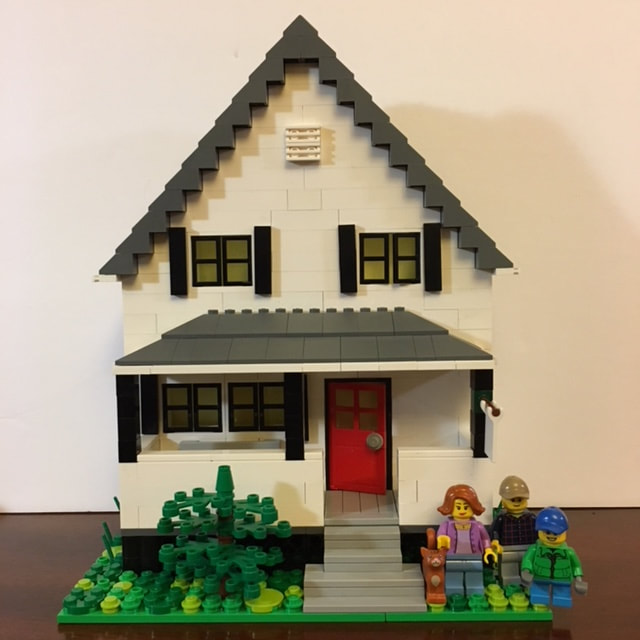
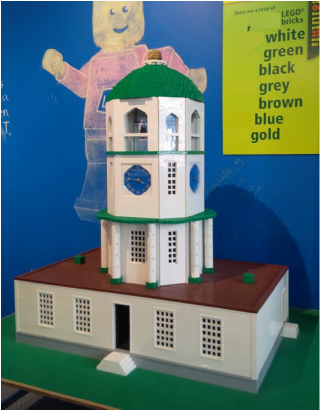
Over the Christmas holiday, the number of LEGO bricks in my house increased significantly. My son received LEGO sets as gifts from numerous grandparents, aunts and uncles. I was a LEGO fan when I was a child and now I have an excuse to play with them again as an adult. We've had lots of fun recently building sets and designing our own creations. At some point I became inspired to create a scale model of our home. Planning and BuildingI started this small project by building a test model to try out the proportions and to see what kinds of bricks I would need. The sizes of the door and window established the overall size. I continued revising the structure it until it looked right and then started collecting the bricks I needed.
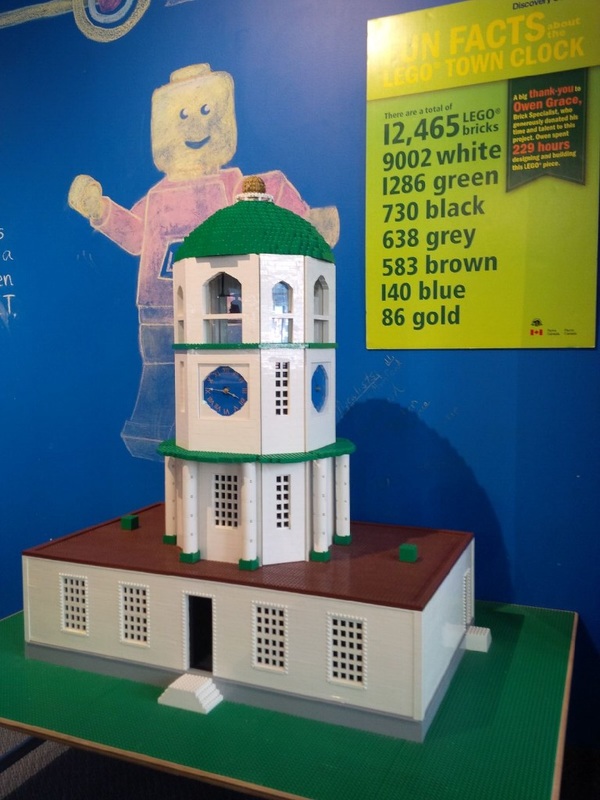
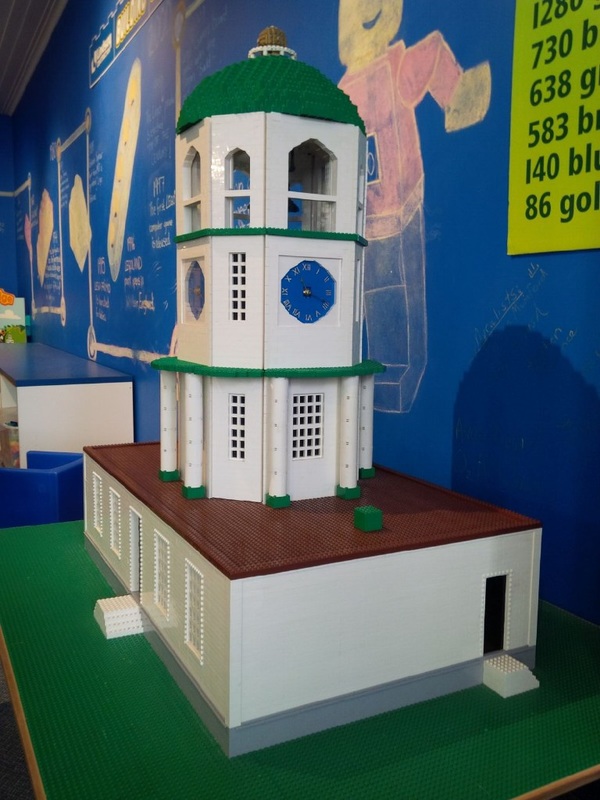
Building this model reminded me of working on an OpenMiddle.com math problem. In an "open middle" problem, there is a one starting point and one solution but many different paths to get to the solution. With LEGO, there are many different ways to create, revise and improve your model. There are lots of different building techniques that will all result in a well designed scale model. ScaleAfter I created my initial rough model I did some reading up on LEGO scale. It turns out that it is a fairly complex topic that lots of different people have investigated. I found the Brick Architect web site to be very helpful. For "classic minifigure" scale a ratio of 1:42 can be used. One major difficulty in discussing scale is that the proportions of a LEGO minifigure are not even close to the proportions of an actual person. A LEGO minifigure is about 4 cm tall and 1.6 cm wide. An average male human is about 175 cm tall and 40 cm wide... about half as wide as a minifigure would be at that height. Another challenge is converting units. The architectural drawings of my house are in feet, which I converted to metric (cm), then a scale factor is applied and finally the metric units are converted into LEGO bricks. I found an awesome tool that does this all for you, the LEGO Unit Converter. FinanceI used a lot of estimation to determine how many bricks of each type I would need. LEGO bricks are not cheap so you don't want to order more than you need (Check out Jon Orr's activity involving cost, Is LEGO Gender Biased?). I purchased the bricks I needed on BrickLink.com, a large online LEGO marketplace. BrickLink provides a detailed price guide for every brick available which makes it really easy to know if you're getting a good deal or not. 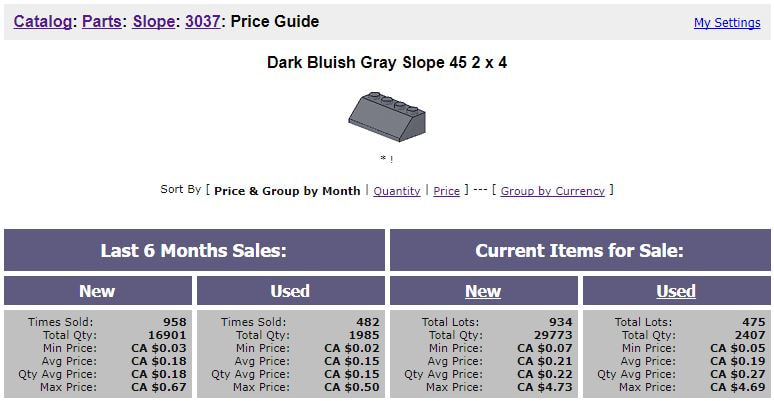 I needed lots of 45 degree angle slope bricks for the roof of my house. These price stats let me know what a reasonable price is to pay for new or used bricks of this type. It is amazing to see how many bricks are sold on this site. I think that the stats from this site could make for an interesting grade 12 math research project. The Finished Project
EL
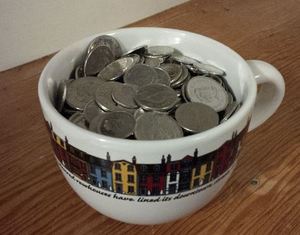
When I got home, I did a search to find out why the machines were gone and ran across a story from Global News. It turns out that TD Bank had decided to retire all the coin counting machines in Canada in the wake of reports from the U.S. that the machines were short-changing customers. In a segment on the Today Show called 'Rossen Reports', a team investigated the accuracy of a number of Coinstar machines as well as coin-counting machines at various branches of TD Bank. The team tested the accuracy of the machines by carefully preparing bags filled with exactly $300 worth of pennies, nickles, dimes and quarters. They then used the machines to see how close their count was to $300. The Coinstar machines all checked out with the correct $300 total. The TD Bank machines did not fare so well. The totals on the machines tested at 5 different branches were: $299.95, $299.47, $299.30, $296.27 and $256.90. None of the machines returned an accurate $300 count. I don't think that machines can really be "100% accurate" all the time. What level of accuracy do you think is acceptable from a coin-counting machine? How much time does it take to roll $300 worth of coins and how much is your time worth? I would probably accept $299.95 for the convenience of not having to roll that many coins. I would be a bit more hesitant to accept $296.27 and definitely would not accept $256.90. While the TD Bank machines were free for customers, in Canada, Coinstar machines apply a coin counting fee of 11.9 cents per dollar. For the $300 counted in this test, the fee would have been $35.70. That is a pretty hefty fee. Questions and EstimationsAccording to a class action lawsuit filed in New York in April 2016, TD’s coin-counting machines processed 29 billion coins in 2012. Based on this figure and the data collected by the Rossen Report, how much money do you think customers lost? What factors did you consider when making this estimate? How would you design an experiment to test the accuracy of TD's coin counting machines? Would you test lots of different machines or a few machines multiple times? How many trials would you run to be confident in your results? What factors might contribute to the errors discovered in these machines? Nova Scotia Mathematics Curriculum Outcomes Mathematics 11 S02 - Interpret statistical data, using: confidence intervals, confidence levels and margin of error. Mathematics 11 S03 - Critically analyze society’s use of statistics. Grade 9 SP03 - Students will be expected to develop and implement a project plan for the collection, display, and analysis of data by: formulating a question for investigation; choosing a data collection method that includes social considerations; selecting a population or a sample; collecting the data; displaying the collected data in an appropriate manner; drawing conclusions to answer the question. Grade 7 SP06 - Students will be expected to conduct a probability experiment to compare the theoretical probability (determined using a tree diagram, table, or other graphic organizer) and experimental probability of two independent events. EL
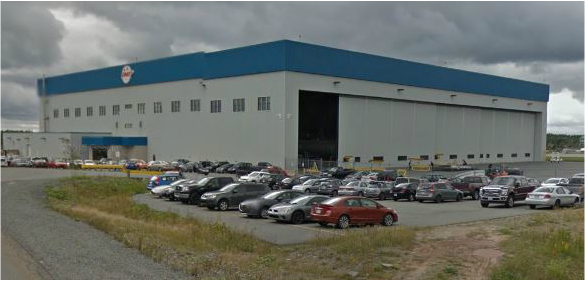
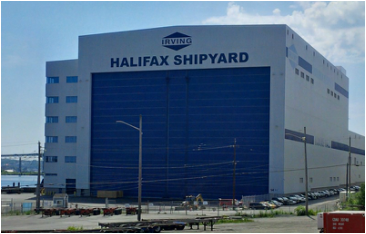
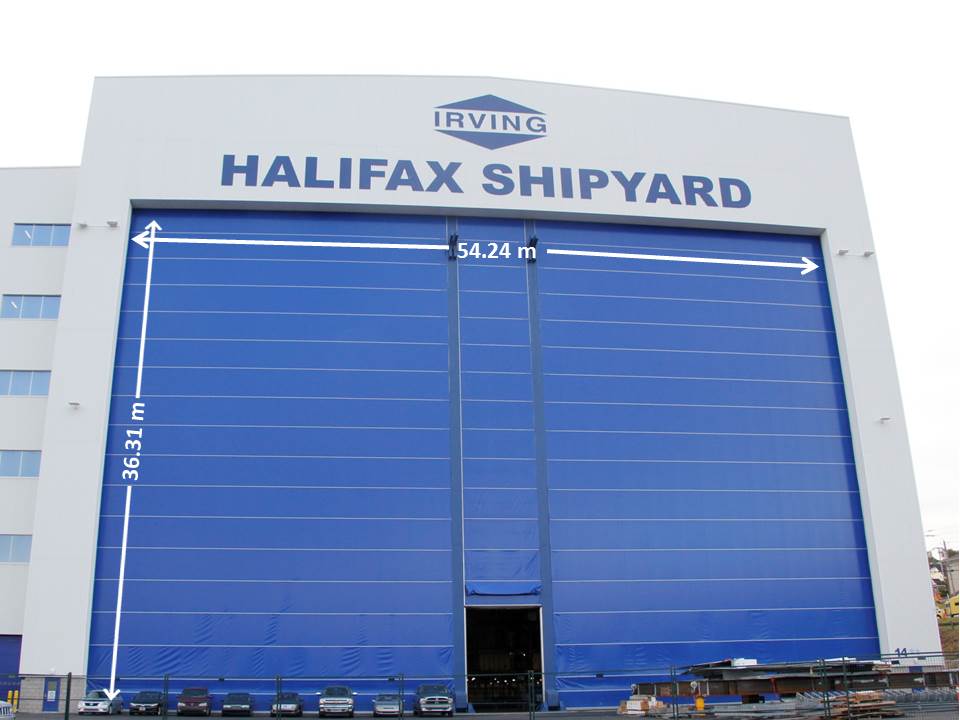
There are some really big doors around Halifax. The door on Irving Shipbuilding's Halifax Shipyard Assembly and Ultra Hall facility is big enough for large "mega-blocks" of ships under construction to pass through. The doors at IMP Aerospace's Hangar #9 at the Stanfield International airport is big enough for large aircraft to pass through. Which door do you think is the largest?
What Do You Mean by Largest?The first thing you might want to do is settle on what you mean by "largest". Do you mean width, height, area, mass or some other measurement? Each of these doors might be the largest for a specific measurement. For example, the aircraft hangar door is made of metal and quite probably has more mass than the shipyard door which is constructed of a polyester fabric. Estimating DimensionsThe shipyard door is really tall but the aircraft hangar door is really wide. Below are pictures of the two facilities from Google earth with the same scale so that you can compare the buildings that these doors are on. 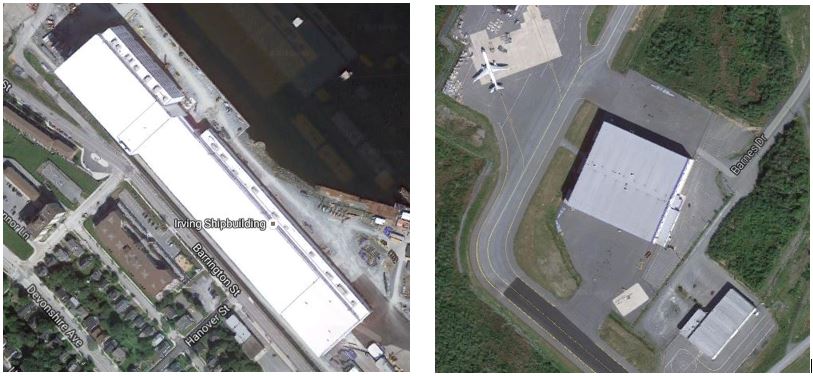 https://www.google.ca/maps/@44.6674497,-63.5972041,542m/data=!3m1!1e3 https://www.google.ca/maps/@44.8701869,-63.5322158,573m/data=!3m1!1e3 Door Dimensions and Surface Area
So the shipyard door has the largest height and the largest area but the hangar door has the largest width and the largest mass. Would you call this a tie? How would you determine the winner?
More Big DoorsDo you know of other big doors around Halifax? Have you seen bigger doors in other parts of Nova Scotia or the rest of Canada? What is your definition of door? Note of Thanks: I want to say thank you to the people at both Irving Shipyard and IMP Aerospace who were very helpful providing information for this post. EL
Here are a few questions that I thought about:
Below are some additional photos:
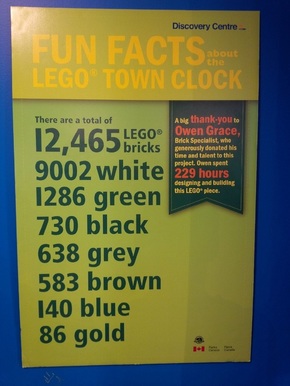
Given the list of lego bricks, you could ask students a number of additional questions:
The Discovery Centre is currently working on a project to build Canada's largest Lego mosaic wall. The wall will be installed at the Discovery Centre's new location when it moves. Nova Scotia Mathematics Curriculum Outcomes Mathematics 7 - N07 Students will be expected to compare, order, and position positive fractions, positive decimals (to thousandths), and whole numbers by using benchmarks, place value, and equivalent fractions and/or decimals. Mathematics 8 - N03 Students will be expected to demonstrate an understanding of and solve problems involving percents greater than or equal to 0%. Mathematics 8 - N04 Students will be expected to demonstrate an understanding of ratio and rate. Mathematics 9 - N03 Students will be expected to demonstrate an understanding of rational numbers by comparing and ordering rational numbers and solving problems that involve arithmetic operations on rational numbers. Mathematics at Work 11 - G02 Students will be expected to solve problems that involve scale. EL
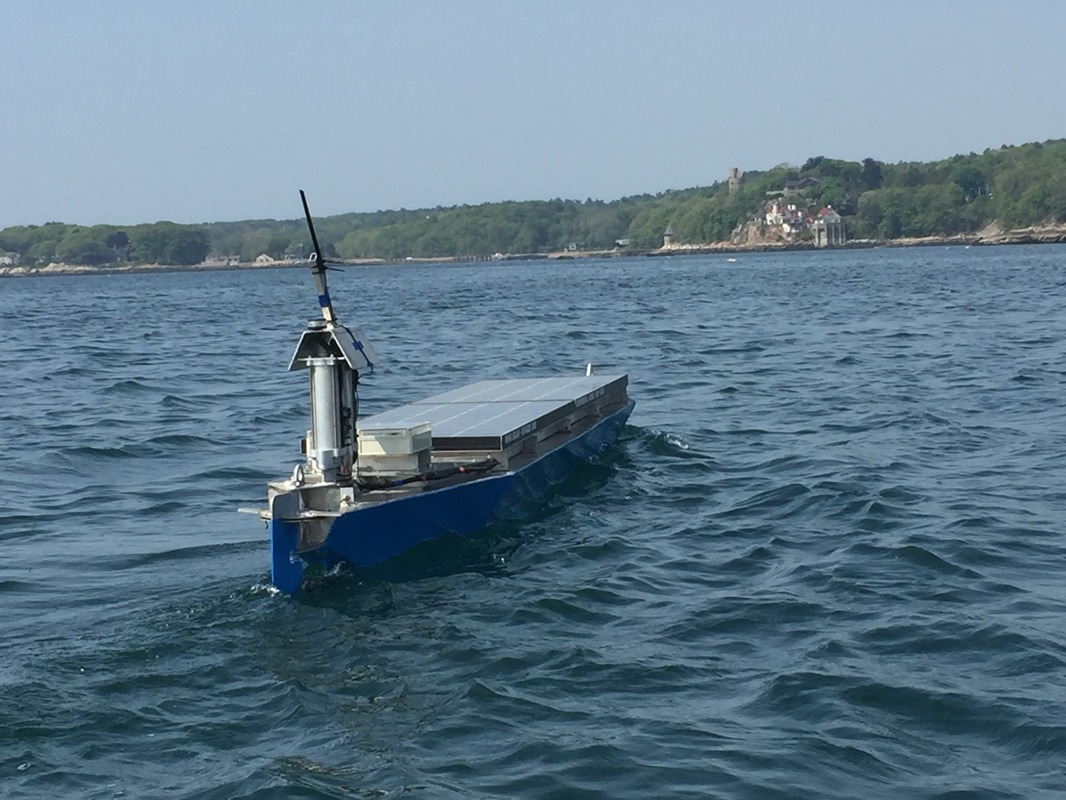
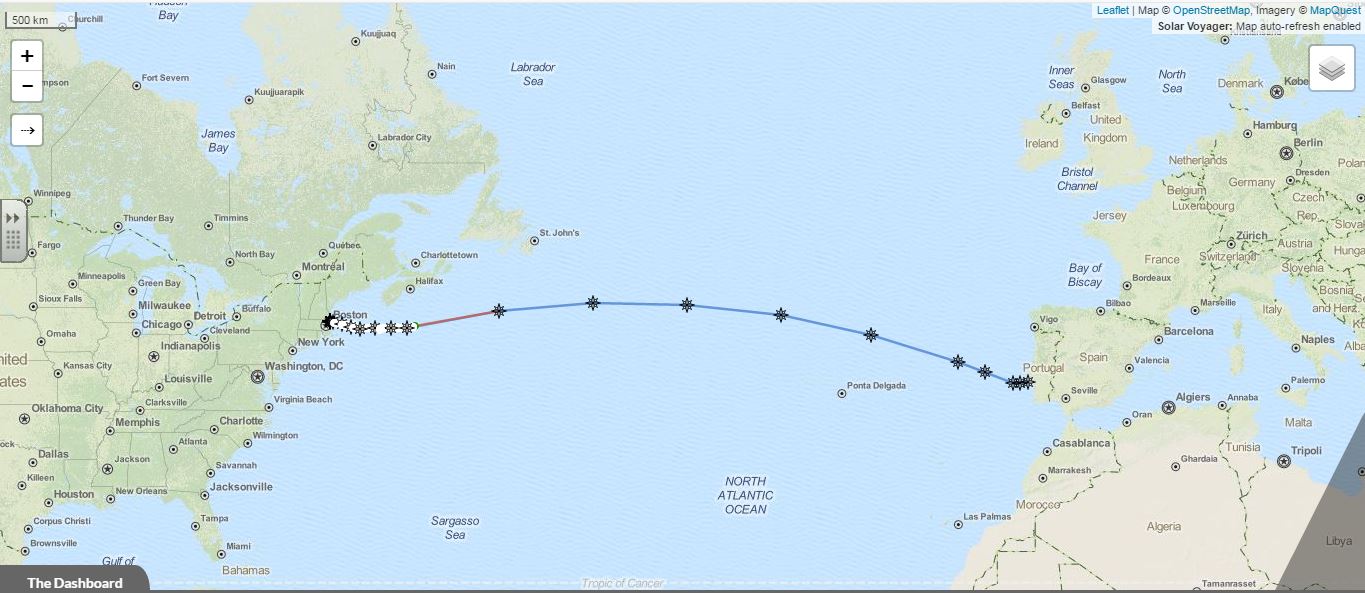
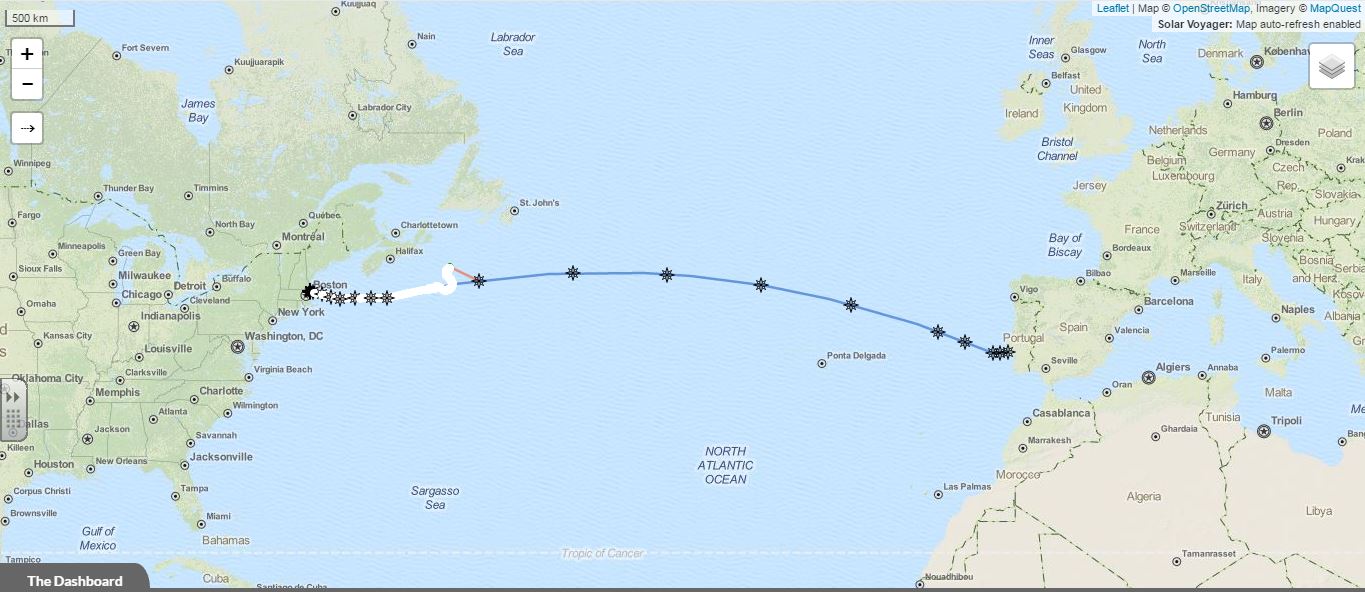
I recently read an article on Wired about the Solar Voyager. A pair of engineers, Isaac Penny and Christopher Sam Soon, designed and built an autonomous, solar powered vessel. On June 1st, 2016 the 18 foot vessel, named Solar Voyager set off on its trans-Atlantic adventure from Gloucester, Massachusetts to Portugal, a journey of more than 4800 kilometres. They are predicting that this trip will take 4 months, assuming that there are no catastrophic events mid-Atlantic. One cool thing about this trip is that the Solar Voyager reports it position and other data online every 15 minutes at http://www.solar-voyager.com/trackatlantic.html. Currently, about two-weeks into its journey, Solar Voyager is just South of Halifax, Nova Scotia where I live.
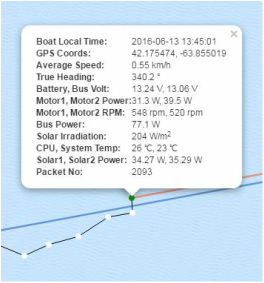
The image below shows how far the Solar Voyager has traveled during its first two weeks. That is 1/8 of the time estimated for the crossing. Based on the information below, do you think that it will reach its destination in 4 months? What factors did you consider when making your estimation? 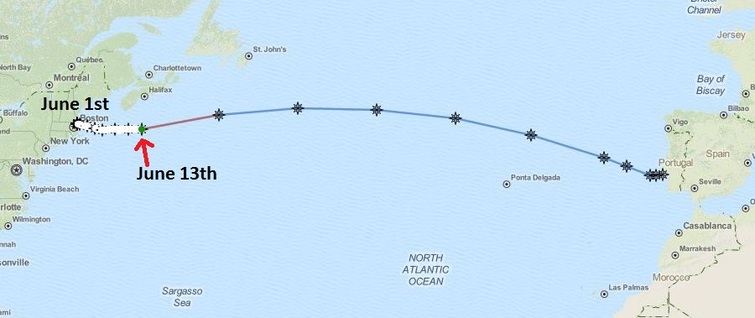 Some factors you might consider are currents, weather, equipment malfunction, obstacles/collisions, wear and tear, etc. There are so many variables at play that it must be very hard to make an accurate estimation. Some Questions/Estimates for Students:
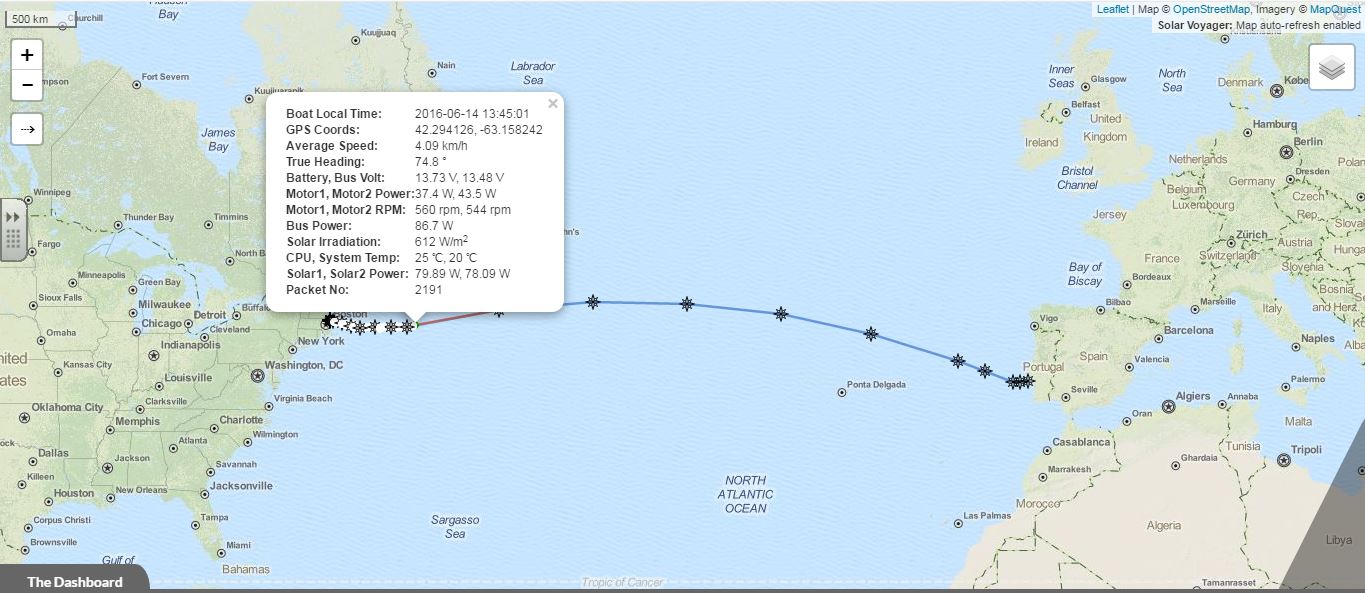
One of the coolest things about this project is that these young engineers "built Solar Voyager in their free time, undertaking this voyage simply for the challenge." How can I commandeer this type of intrinsic motivation for students in math class? What about this project made them want to work so hard "just for the challenge" and not for some extrinsic reward. Was it because they were the ones who selected and designed the task? Did they have just the right skills so that they felt confident that they would be successful? What is something that was relevant to their lives? How did this project captivate their curiosity? Data Points:
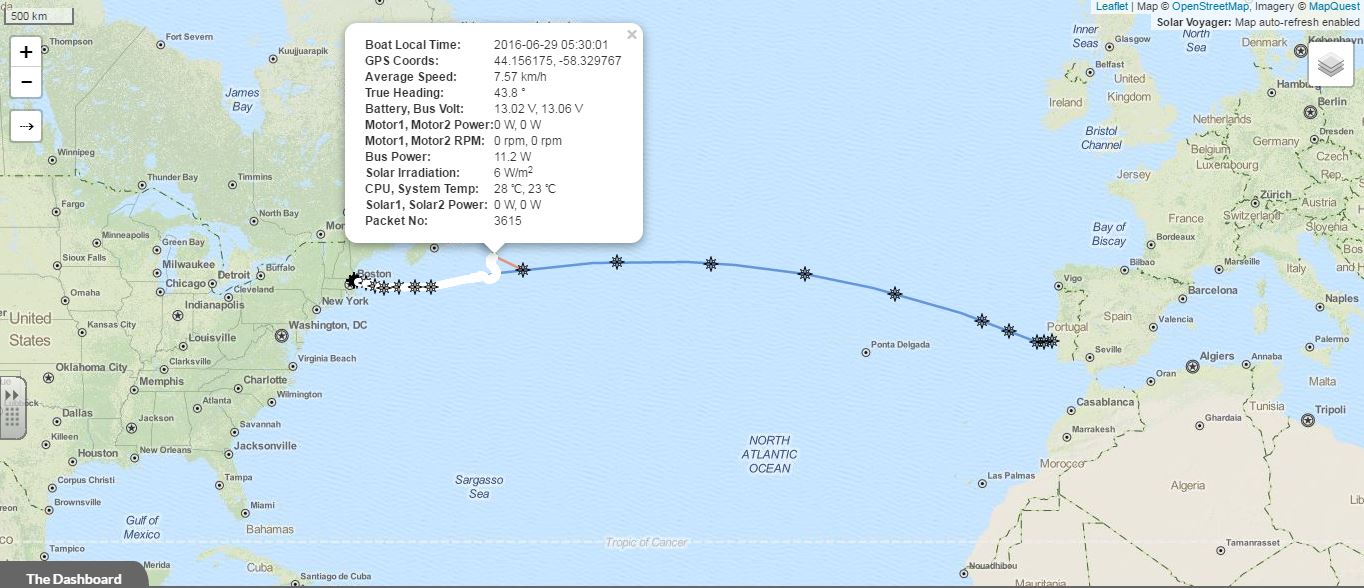
Update: Solar Voyager ran into some trouble south of Nova Scotia. It appears it got tangled in some fishing gear and the props and rudders were fouled. After drifting for over a week, the vessel was picked up by HMCS St. John's, a Canadian Navy offshore patrol vessel.  The track of Solar Voyager as of the morning of Wednesday, June 29th. EL
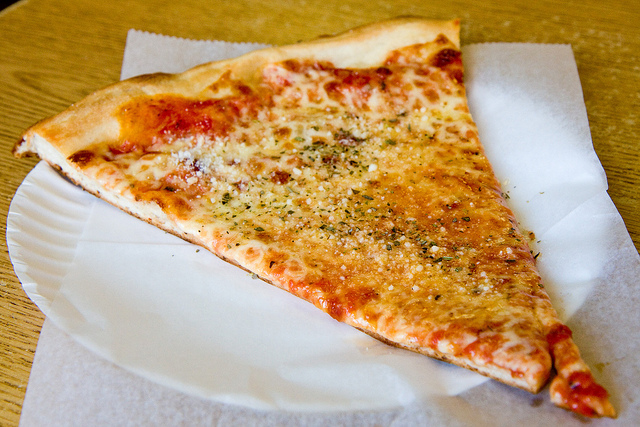
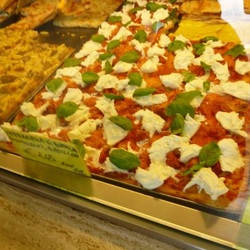
Students and Staff at J.L. Ilsley High School recently returned from a March break trip to Italy. Their stories about Rome and pizza and gelato inspired this "Would You Rather?" math question. Most students are pretty familiar with pizza and have strong opinions to share on their favourite type and restaurant for pizza. Would you rather have a slice of pizza from New York or from Rome? The New York pizza costs $2.75 US per slice. The Rome pizza costs 1,50€ per 100 grams.
In Rome, pizza by the slice or "pizza al taglio" is typically sold in rectangular pieces by weight. Prices are often listed per 100 grams. Prices can vary greatly depending upon the type and location of restaurant. Restaurants close to major tourist attractions in Rome are often much more expensive. The price I quote above is from Pizza Florida in Rome. Estimating the weight of a typical slice of pizza might be difficult for students. How much does a typical piece of pizza weigh? According to Pizza Pizza, a 1/10 slice of a 14 inch diameter pizza is approximately 110 grams. There is also the issue of currency conversion. You could ask for 3 Euros worth of pizza, but how much will that cost you in Canadian dollars? An online currency conversion website or app can help with currency exchange. The Nova Scotia Mathematics 10 curriculum has outcomes on both currency exchange and SI to imperial unit measurement conversions so I thought this would be a nice warm up question to be used in that course. In case you were wondering where you should go to eat pizza, here are the 14 top cities for pizza, as identified on the Conde Nast Traveler Best Pizza in the World list. Note that a Canadian city, Edmonton, made the list.
Nova Scotia Mathematics Curriculum Outcomes
Mathematics 10 - M02 Students will be expected to apply proportional reasoning to problems that involve conversions between SI and imperial units of measure. Mathematics 10 - FM01 Students will be expected to solve problems that involve unit pricing and currency exchange, using proportional reasoning. |
Categories
All
|
|||||||||||||||||||||||||||||||||||||||||||||||||
 RSS Feed