|
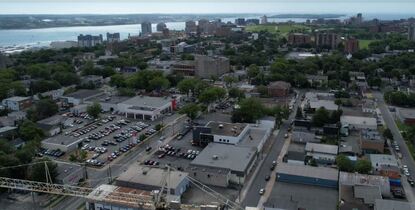
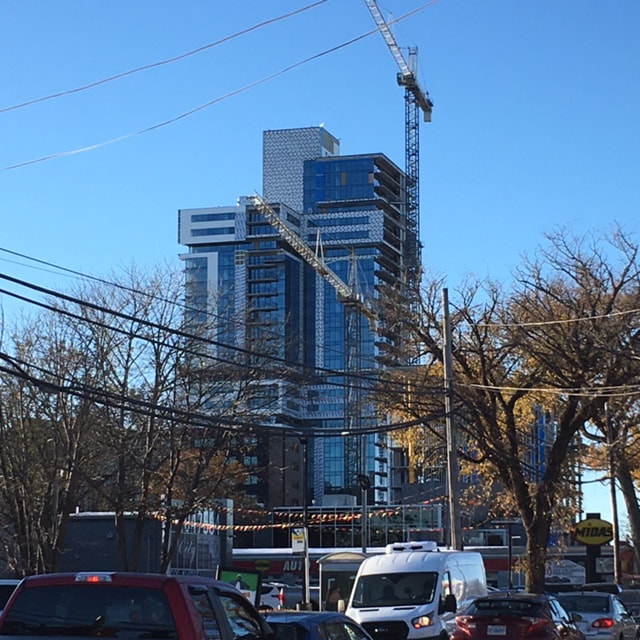
There is a new building going up in my neighborhood. It is so tall, that you can see it from the school I teach at. It makes me curious... how far do you think you could see from the top? As my students are learning about trigonometric ratios, I thought this might be an opportunity to bring the community into the classroom. I asked students to make a prediction about how far they could see given the pictures below. I also let them know that if you stand on the beach, you can see the horizon about 4.8 km away for an average height person (a lot of their initial guesses were even less than this).
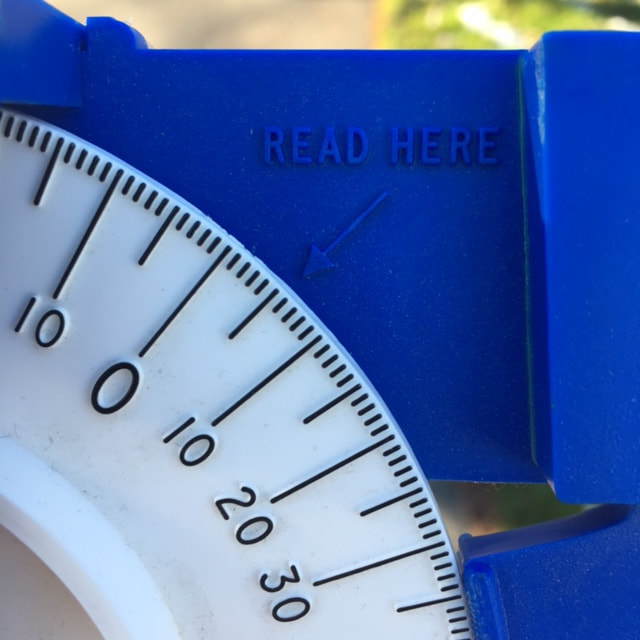
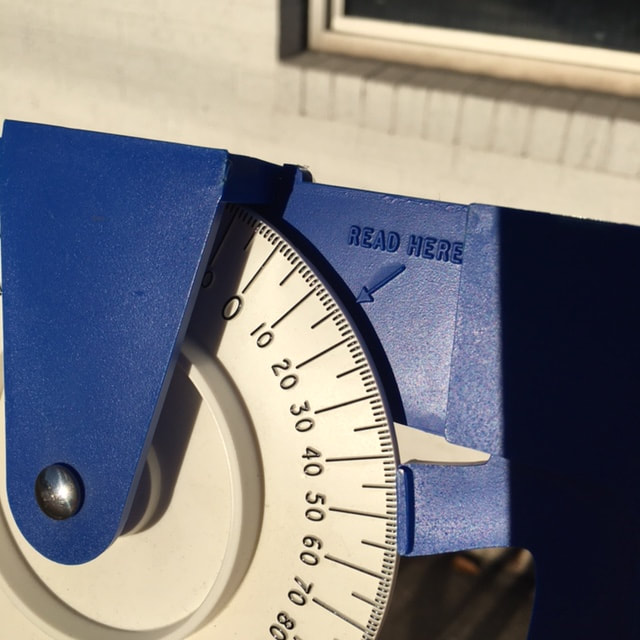
The first step in satisfiying my curiosity is to collect some data. On my bike ride home, I stopped a couple times to take a picture of the building and to use my Invicta MK1 clinometer to measure the angle of elevation to the top of the building. The first stop was just in front of the school and the clinometer measured about 5 degrees.
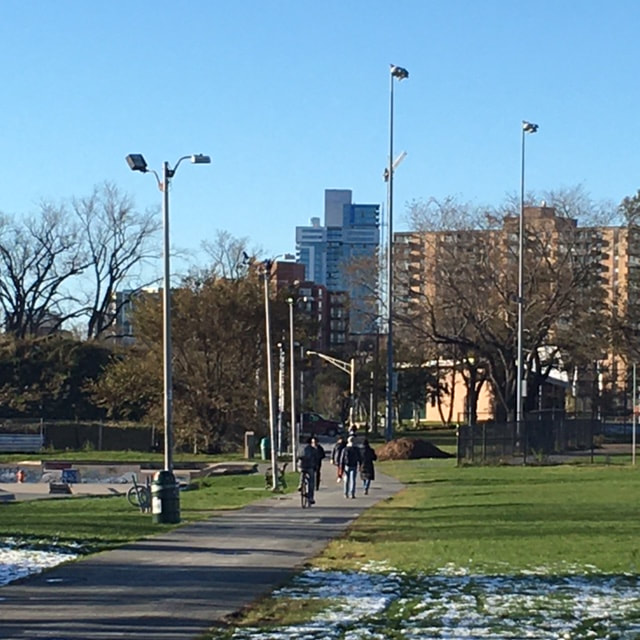
About a kilometer further down the road, I stopped again for some more pictures and measurements. This time, the angle of elevation to the top of the building was about 15 degrees.
I used Google Earth to measure a more precise distance between my two stops. It said that the places where I took the measurement were 1097.98 m apart... lets just call it 1098 m. Now to set up a picture of the situation and include some data. 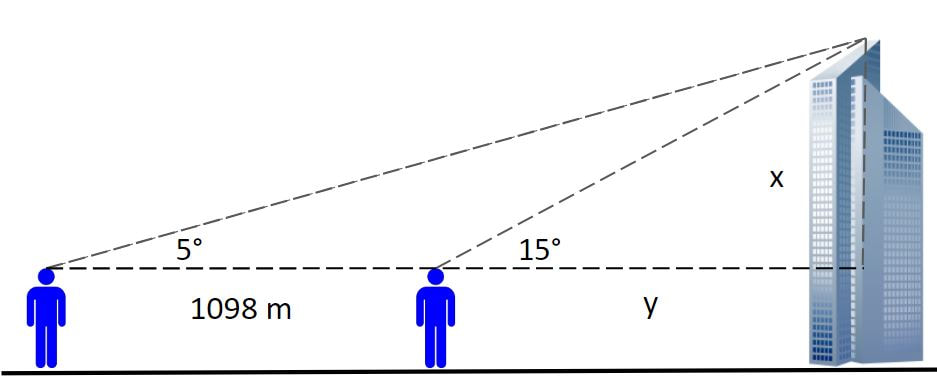 And now for some calculations... 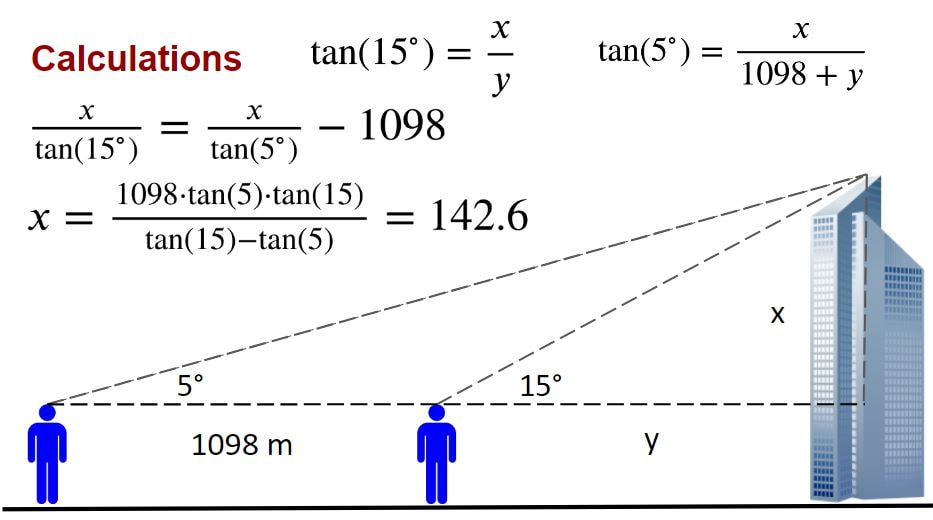 At this point, I paused to let the class know that I already knew the height of this building... and my answer was not nearly as accurate as I'd like it to be. I was able to find the building permit online and it says the the building is precisely 103327 cm tall... lets just say 103.3 m. So how did I get so far off? I asked my students to brainstorm some possible sources of error. One is my clinometer. I can only read the angle at an accuracy of about +/- 1 degree... and 1 degree of error at that distance makes quite a big difference in the height. Another source of error is the ground... unlike almost every textbook question, my city is not perfectly flat. Looking at a topological map, I can see that the ground rises about 20 meters over the distance that I took measurements. Not enough to look like you're on a hill but enough to make a difference in my calculations. One final source of error might be that my two measurements were not perfectly in line with the building. I'm not sure how much of a difference this might make but I know it added an additional bit of error. All in all, it was a good conversation about how real life is often not as simple as it looks in the textbook. So back to our question... how far can you see from the top? Well, that is where another right triangle can help. Given the height of the building (103.3 m), the location of the building on a hill (60 m above sea level) plus my height of eye (1.74 m), we can find out how far about sea level the viewpoint is. Since this building has a clear view of the ocean horizon, we can calculate the distance fairly accurately (I figured this part out after listening to an episode of the A Problem Squared podcast). 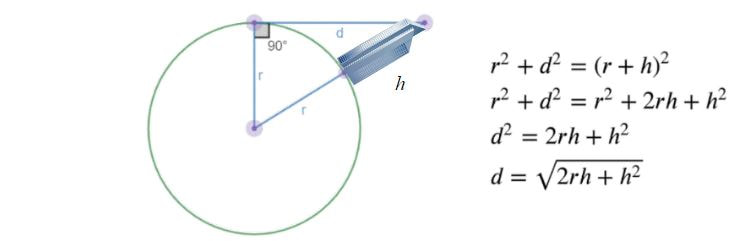 So all these number and calculations tell me that, given the radius of the Earth (about 6371 km) and the height of the view (165.04 m) we have a view distance of 45.9 km. There was much rejoicing by the student who predicted the closest.
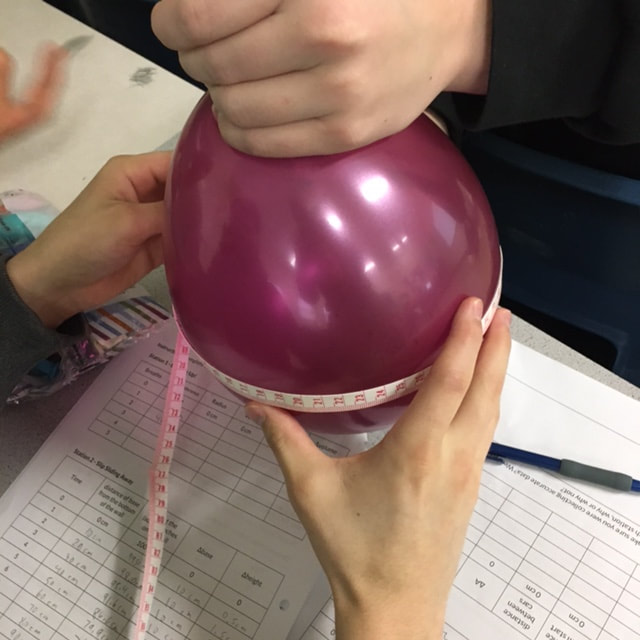
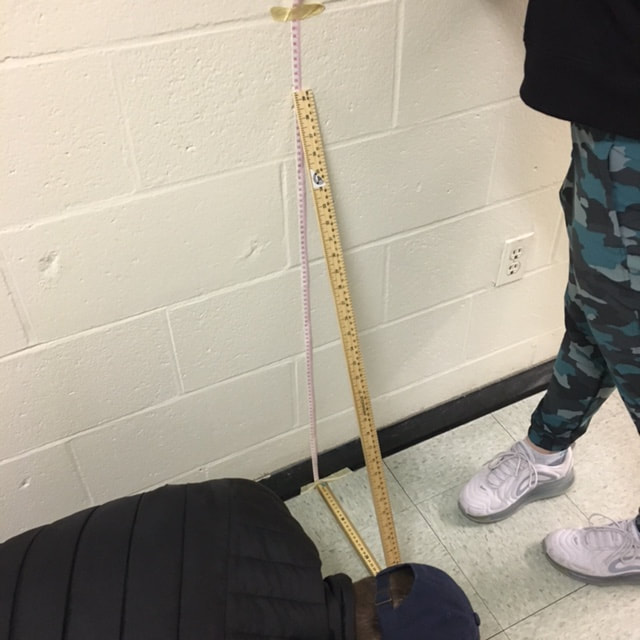
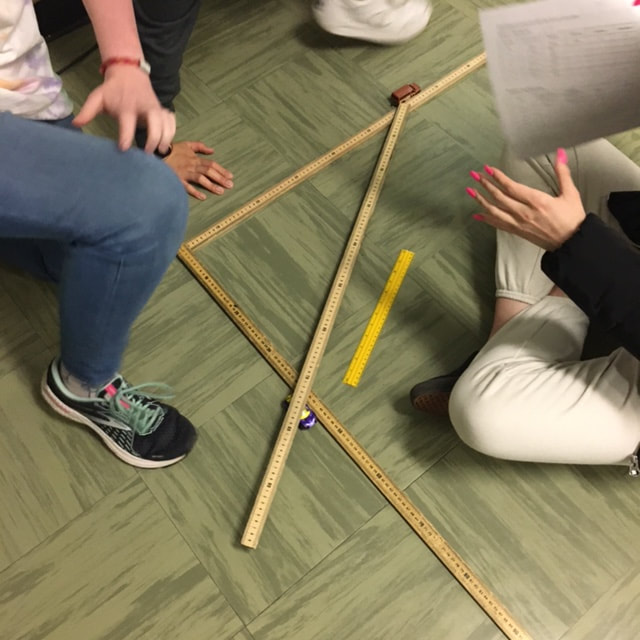
In previous years, I've taught related rates in calculus class by the book. As in, we worked through the example problems from the textbook together and then students individually worked on the practice problems. After working through some examples, I would give students some more challenging problems as an assignment. Recently, a teacher reached out looking for some new ideas for teaching related rates. We brainstormed some ideas of how we could make related rates more engaging and hands-on. We decided to create some stations where students could experience and take measurements of related rates in action. It turns out, this is probably the reason that related rates problems are in our textbook. While doing some research to prepare this activity, I found an article titled, "The Lengthening Shadow: The Story of Related Rates" by Bill Austin, Don Barry and David Berman. This article is from Mathematics Magazine (Feb 2000, Vol. 73, No. 1, pp. 3-12). In this article, the authors state that related rates problems originated in the 19th century as part of a reform movement to make calculus more accessible. By observing changing rates, students would be able to measure concrete examples and discover their relationships. Joshua Bowman discusses how he grounded his teaching of related rates using observations in his blog post Using calculus to understand the world. Related Rates StationsFor this activity, we decided on four stations: Station 1 - Blowing Up a Balloon. Blow 5 big breaths into a balloon. After each breath, measure the circumference of the balloon and calculate radius and volume. How are radius and volume related? Station 2 - The Sliding Ladder. A metre stick is sliding down the wall. The bottom of the metre stick is moving away from the base of the wall at a constant rate. How fast is the top of the stick sliding down the wall? How are they related? Station 3 - Building Fences. Build several “fences” (rectangles made with multi-link cubes) such that the length is twice the width. Put them in order of size. Measure each rectangle’s length and width. What is the rate of change of the area? How are perimeter and area related? Station 4 - Driving Cars. Two toy cars are traveling at different rates in perpendicular directions. How fast are each of the cars travelling? How fast is their distance apart changing? How are they related?
After taking measurements at each of these stations, students drew a picture and created an equation to relate the quantities to each other. We used implicit differentiation to determine the relationship of the rates and then we tested our equations with our collected data. Reflection and ResourcesThe activity went a bit long for one class period. Next time I would either split the activity up over two class periods or reduce the number of stations to three. This will allow more time to consolidate the learning at the end of the lesson. As Tracy Zager says, "never skip the close." If you're interested in giving this activity a try, below are the files I used: Related Rates Stations Google Slides Related Rates Recording Sheet Update - 13 AprilAfter doing this activity a few times in classrooms, I decided to reduce the number of stations from 4 to 3. In a 75 minute period, students were able to complete the three stations with a few minutes at the end to consolidate the lesson. I also changed the set up for the driving cars question to make it a bit more interesting. Here are the updated files that I've been using for 3 stations and a different problem for the driving cars problem. Related Rates Stations Google Slides Related Rates Recording Sheet Nova Scotia Mathematics Curriculum Outcomes Calculus 12 A3 - Demonstrate an understanding of implicit differentiation and identify situations that require implicit differentiation Calculus 12 B14 - Solve and interpret related rate problems EL
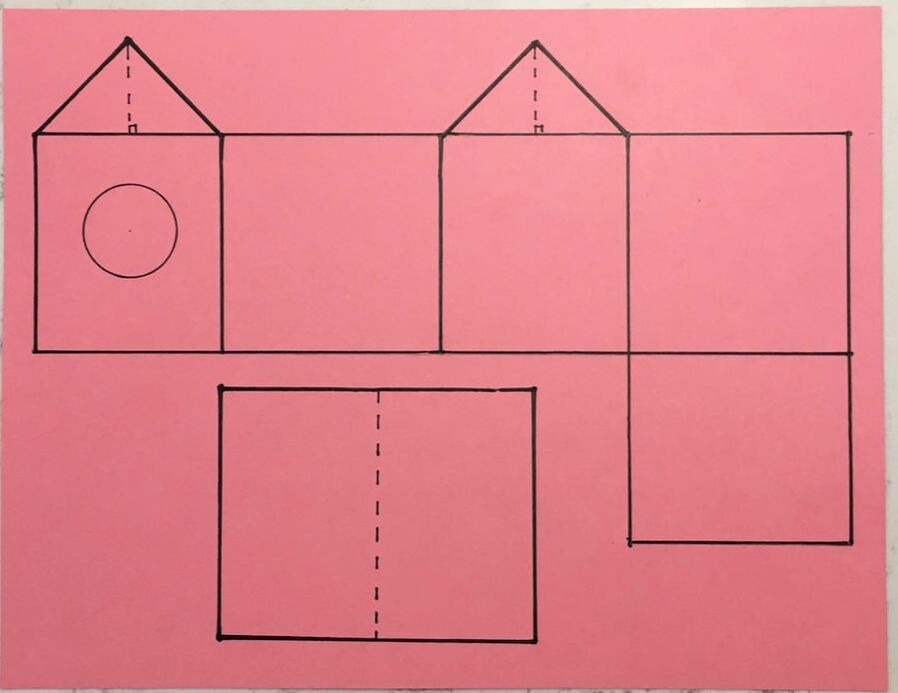
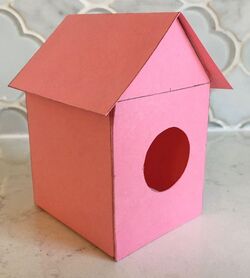
"Design and build a model birdhouse from a single sheet of 8.5" x 11" sheet of paper." This open ended activity seems simple at first but will require careful planning and attention to detail for students to be successful. 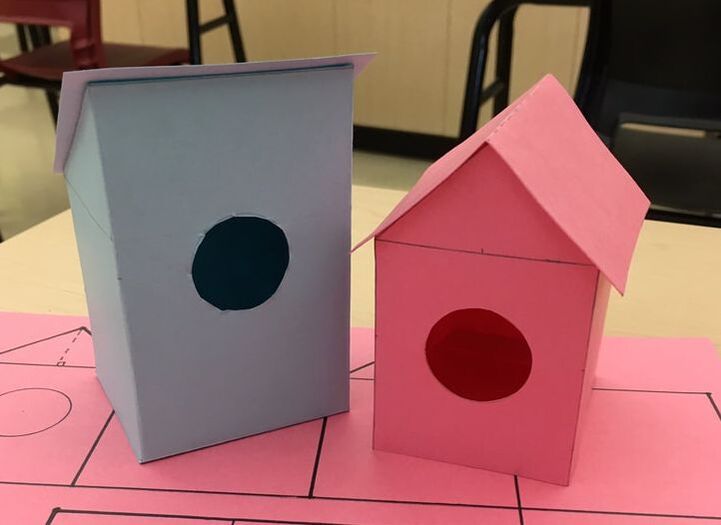 You might start off this activity by showing a photo of an actual birdhouse and asking students to brainstorm the features of a good birdhouse. A website like this one might be a good guide. Next you can talk about the expectations for their model birdhouse design:
Students should then be asked to create a design. The design should minimize wasted paper (i.e. use as much of the page as possible) and be easy to assemble (i.e. minimize the number of pieces you have to cut out and assemble). You can then show students an example of a finished design.
ProcedureStep 1 - Students should brainstorm some possible designs (at least two) on a piece of looseleaf Step 2 - Ask students to pick their favourite idea and share it with the teacher Step 3 - Once the teacher approves their design, students are given a piece of card stock. They can then lay out their design with a ruler Step 4 - When finished, students will measure and record all dimensions for their model. Students then calculate the surface area and volume of their design Step 5 - The final step is to cut out and assemble their birdhouse model! Here is a Google slides document that could be used to introduce the activity to students and make the expectations clear. Math at Work 10 Activity: One teacher modified this activity by giving students a selection of designs to choose from instead of designing their own (here are links to pdf template 1 and template 2). Students then did all of the measurements and computations and had to determine costs for shingles on the roof, siding for the walls and paint for the interior. Here is a handout similar to the one she used. Extensions: If you were to take your model and use it to build an actual birdhouse from wood, what would have to change? By what scale factor would you have to increase the size? How would building with 3/4" thick wood (instead of flat paper) change the size of the pieces needed? What supplies would you need and how much would it cost to build? NS Outcomes: Mathematics 9 - G01 Students will be expected to determine the surface area of composite 3-D objects to solve problems Mathematics 10 - M03 Students will be expected to solve problems, using SI and imperial units, that involve the surface area and volume of 3-D objects, including right cones, right cylinders, right prisms, right pyramids, and spheres. Mathematic at Work 10 - M04 Students will be expected to solve problems that involve SI and imperial area measurements of regular, composite, and irregular 2-D shapes and 3-D objects, including decimal and fractional measurements, and verify the solutions. Mathematics Essentials 12 - 2.4 Sketch and construct a model which will enable a student to show others some mathematics involved in a career interest EL
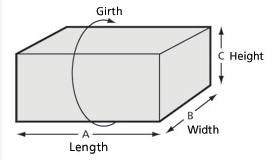
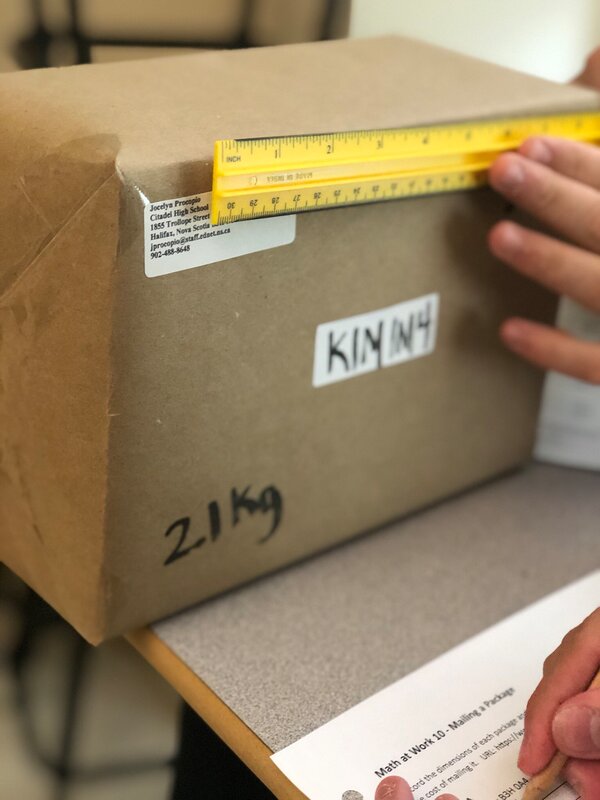
How much does it cost to mail a package in Canada? What factors determine the cost of postage? If you have ever put a box in the mail at a Canada Post location, you'll notice the mail person do several things. First they put the box on a scale, then they measure the dimensions of the box with a measuring tape. Finally, they read the postal code for the destination and input it all into their computer. Then they'll tell you the price to mail it. Getting students to measure items with a variety of measurement tools is great practice to get familiar with metric and imperial measurement systems as well as becoming familiar with common measurement units. Sometimes this practice is just measuring lines on a worksheet or measuring objects around the classroom (paperclips, pencils, desks, etc.). This can seem a bit trivial. I was hunting for measurement with a purpose and thought of the measurements that postal employees do. It turns out, you can find the rate for mailing a package by using a page on Canada Post's website.
The students seemed to enjoy the activity and got some purposeful practice using metric and imperial measurements. Here is a link to the google slides for the activity and a recording sheet. NS Outcomes: Mathematics Essentials 12 - 1.6 Identify, use, and convert among and between SI units and Imperial units to measure and solve measurement problems Mathematics 10 - M01 Students will be expected to solve problems that involve linear measurement, using SI and imperial units of measure, estimation strategies, and measurement strategies. Mathematic at Work 10 - M03 Students will be expected to solve and verify problems that involve SI and imperial linear measurements, including decimal and fractional measurements. Mathematics Essentials 10 - D3 estimate distances in metric units and in imperial units by applying personal referents. EL
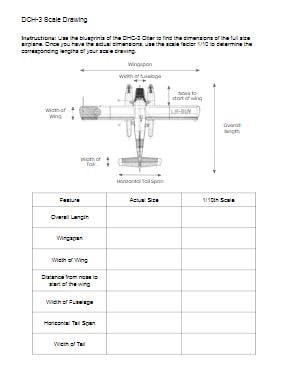
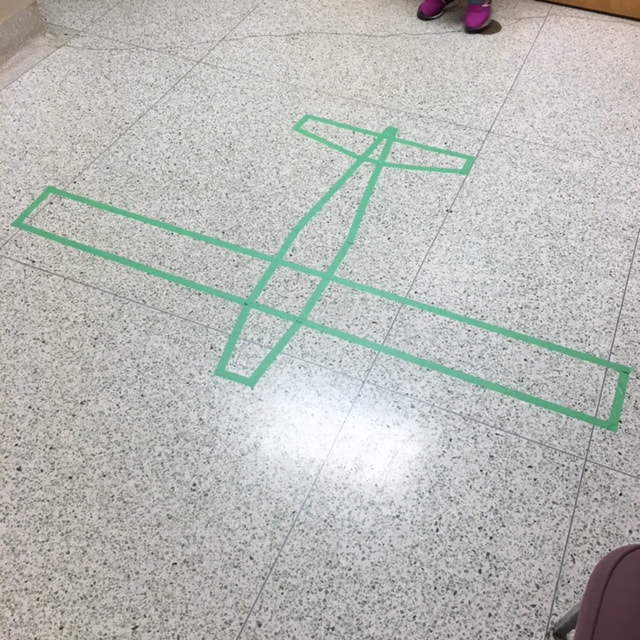
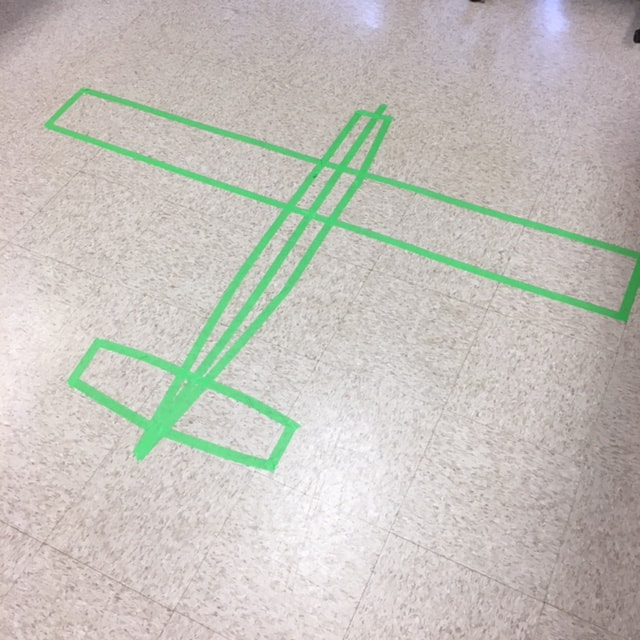
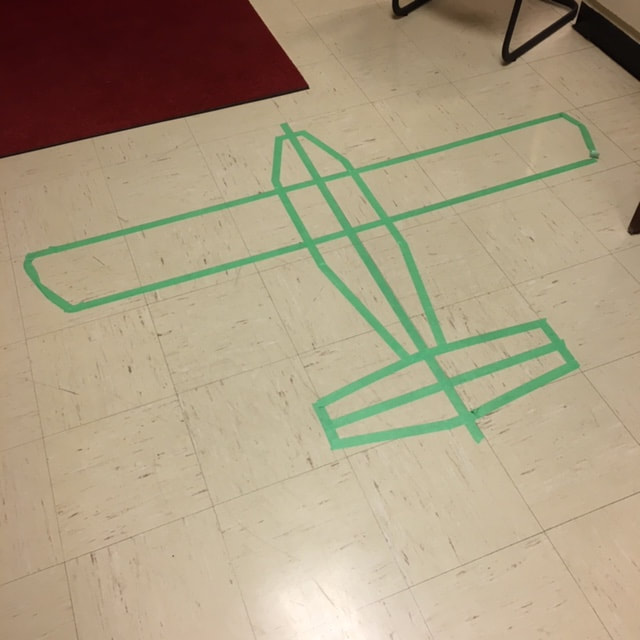
Students work with scale in a number of mathematics courses in Nova Scotia. In the Mathematics Essentials 12 course, they work with scale in conjunction with reading blueprints. This scale activity uses the blueprints for an iconic Canadian airplane, the DHC-3 Otter. I started the lesson with some estimation. 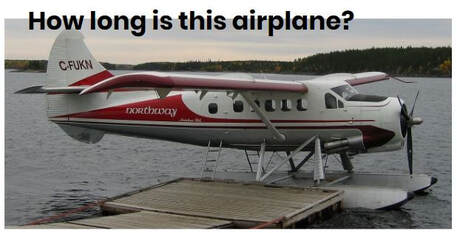 I didn't let students know the name of the airplane to start with so that they don't just Google the name of the airplane and find out the actual length. Instead they use clues from the photo to make an estimate. Some references might include the size of the dock or ramp, the height of the wing, or the size of the windows or door. We use a routine I learned from Estimation180 to ask for an estimate they know is too low, an estimate they know is too high and then a just right estimate. After everyone had made and estimate, I showed them an image from a blueprint and asked them if they'd like to revise their estimate using some additional information. 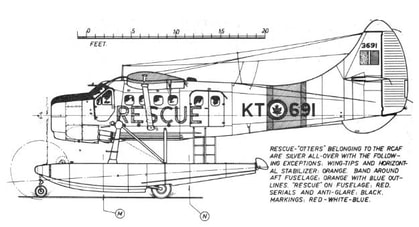 On the blueprint, they can see a scale drawn above the plane. Students use this information to either confirm or adjust their estimate. We can then use the scale to measure the image to find out the actual length of the plane (about 41 ft). After this opening activity, I showed them a picture of a 1/48 scale plastic model and ask them to tell me what the size of the finished model is knowing the size of the actual plane and the scale factor. The opening estimation allowed students a chance to think about scale. Next I handed out the blueprints for the plane. Our task was to use the blue prints to help create a 1/10th scale drawing of the top view of the plane using painters tape on the floor.
Students worked in small groups to recorded their measurements and calculate the measurements for the scale drawing. Once they were finished each group was provided with some painters tape and measuring tapes in order to make their scale drawing on the floor. It could be nice to have one group do their drawing on the wall, then it could stay up as a reference to their work with scale. We also talked about writing their measurements on the painters tape as they put it down. Variations and ExtensionsStudents who finish quickly can continue to add additional details such as the pontoons. This activity could also be done with larger groups creating a life size drawing of this plan using sidewalk chalk outside (weather permitting). NS Outcomes:
Mathematics Essentials 12 - 3.1 Calculate the dimensions of actual objects using blueprints with various scales Mathematics 11 - M02 Solve problems that involve scale diagrams, using proportional reasoning Mathematic at Work 11 - G02 Students will be expected to solve problems that involve scale; and G04 Students will be expected to draw and describe exploded views, component parts and scale diagrams of simple 3‑D objects. Mathematics Essentials 11 - E4 create 2-D scale diagrams and 3-D scale models Mathematics 9 - G03 Students will be expected to draw and interpret scale diagrams of 2-D shapes. Investigations where students discover the relationship between variables can help students build a deeper understanding of functions. Often these explorations are hands on and engaging lessons. They typically start with some sort of interesting video or question prompt such as "What makes for an exciting bungee jump?" or "Which cup will keep my coffee warm the longest?". I was prompted to think about my favourite investigations after seeing a post from Nat Banting on Twitter. Below are a collection of links and descriptions of my favourite secondary mathematics investigations. Linear Relationships
Quadratic Relationships
Exponential Relationships
I like the investigation above because they share several common features.
Do you have a favourite activity or resource for activities? Please let me know what it is. EL
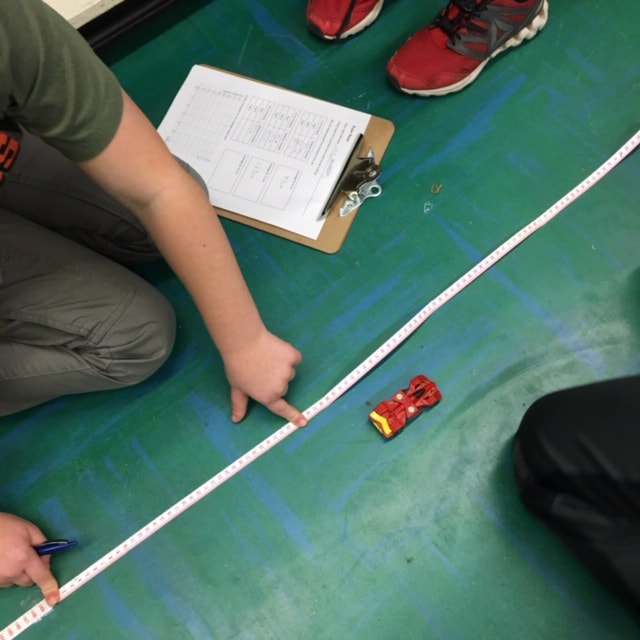
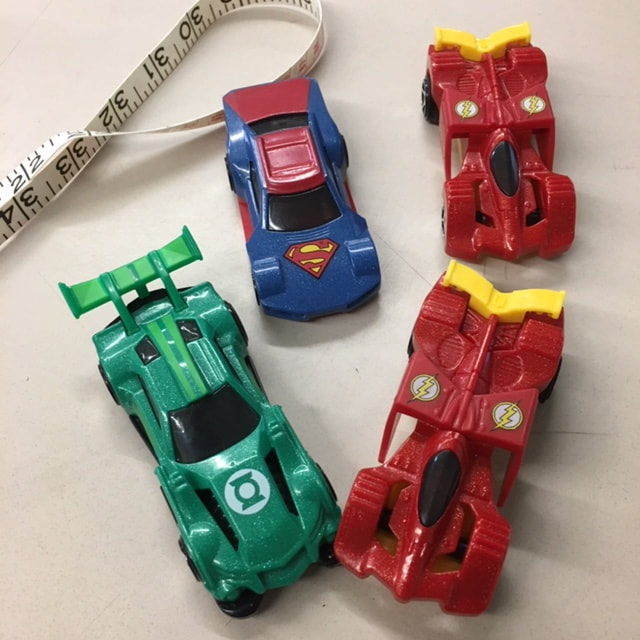
I was recently invited by a class to work with them on collecting and analysing data. After brainstorming some ideas with the classroom teacher, we settled on collecting data from pull back cars. I checked out Fawn Nguyen's Vroom Vroom lesson and Simon Job's Car Racing lesson to get some ideas on how to organize this lesson. We started the lesson by sharing the first half of Simon's video of cars racing across the floor. We had the students do some notice and wonder about the action taking place in the video and then introduced activity.
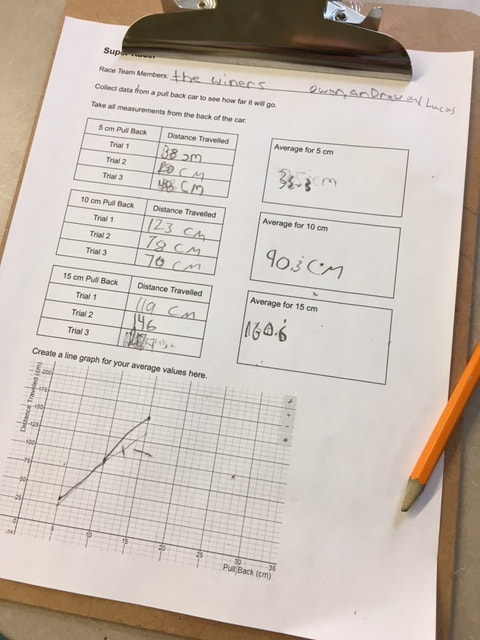
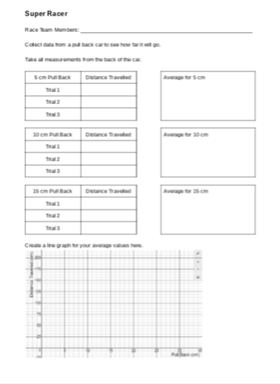
We showed students the recording sheet that we would be using and how we would be taking measurements (A link to the record sheet Google Doc is here). Then we brainstormed some ways to make sure that we all collected good data and avoided errors: we would all use the same units (centimeters), all measure our distances the same way (from the front bumper), not use data if the car bumped into a wall or a desk, etc. We split up into racing teams of three students each. Each group got a measuring tape, a pull back car and a recording sheet on a clip board.
The classroom teacher and I circulated the room (and a bit of the hallway) to help students and answer questions. After students finished collecting their data and plotting their values we came back together as a class. We asked several groups to plot their data on the whiteboard at the front of the room. We then had a discussion about general trends as well as why each car had a slightly different graph. Cars might have different wind up springs, different tire grip, dusty floors, aerodynamics, etc. 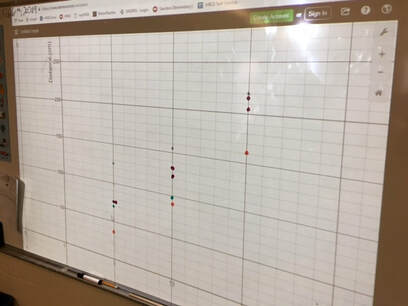 We finished the class with a bit of excitement... the 150 Challenge. Each team had to use the data for their car to predict how much they would need to pull back to make the car travel as close to 150 cm as possible. Teams huddled to interpret their data and select a pull back distance. Each team brought their car to the front of the class to give it their best shot. There was lots of cheering and excitement as some teams got very close. The winning distance was only 2.5 cm! Much closer than I had expected. This activity could be easily extended for higher grade levels by incorporating linear relationships, linear equations and linear regression. Nova Scotia Mathematics Curriculum Outcomes Mathematics 6 SP01 - Students will be expected to create, label, and interpret line graphs to draw conclusions. Mathematics 6 SP02 - Students will be expected to select, justify, and use appropriate methods of collecting data, including questionnaires, experiments, databases, and electronic media. Mathematics 6 SP03 - Students will be expected to graph collected data and analyze the graph to solve problems. Mathematics 9 PR02 - Students will be expected to graph a linear relation, analyze the graph, and interpolate or extrapolate to solve problems. Mathematics 10 RF07 - Determine the equation of a linear relation, given: a graph, a point and the slope, two points and a point and the equation of a parallel or perpendicular line to solve problems. (including RF07.06 Determine the equation of the line of best fit from a scatterplot using technology and determine the correlation) Mathematics Extended 11 S01 - Analyze, interpret, and draw conclusions from one-variable data using numerical and graphical summaries. EL
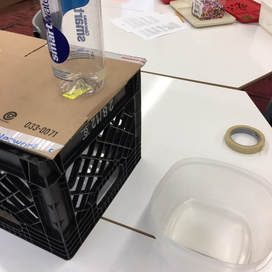
I recently had the opportunity to work with a student to investigate parabolas and quadratic functions. We used one activity to investigate two different quadratic relationships. First we observed the shape of the stream of water coming out the side of a water bottle and then we observed the rate the water drains. The Water FountainI set up a cylindrical bottle of water on a crate. The bottle had a whole in it covered with a piece of tape. I asked students for some predictions. What will the shape of the water coming out of the side of the water bottle look like. What will happens to the stream of water as the water level goes down?
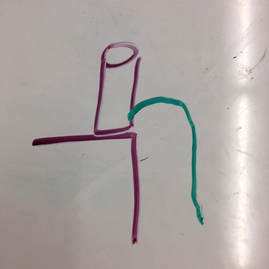
I noticed that the student drew the water stream coming out of the bottle like it comes out of a water fountain (where we had just filled the bottle). We took the tape off the hole and then watched the water come out while making some observations and taking some photos. We selected a good photo (the black bulletin board in the background really helped) and loaded into Desmos. Then we used a table to record some points along the steam of water. After that we did a linear and then a quadratic regression on the point to see that the parabola was a much better fit than a line. We then had a chat about parabolas and projectile motion.
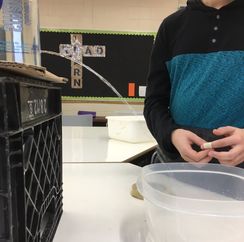
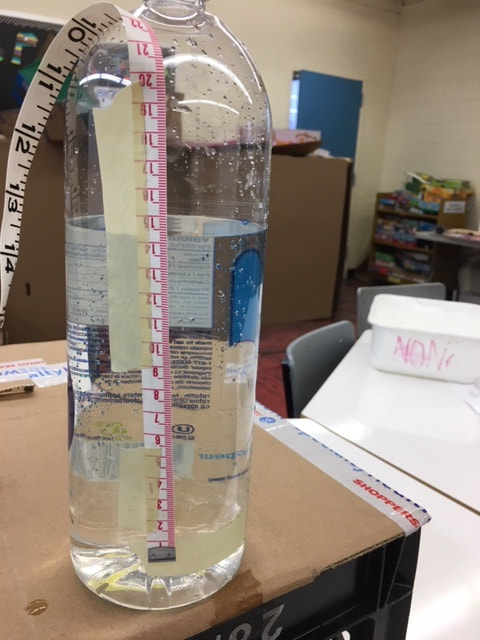
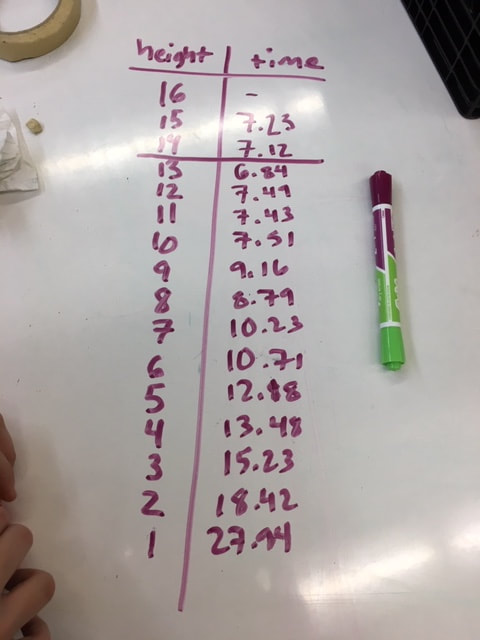
Draining the TankWe set up the water bottle again but this time instead of looking at the shape of the stream of water, we focused on how fast the water level fell. I asked the student to predict what this might look like. You might ask students to predict what a graph of the water level might look like over time for the two situations below. How would the graph look when filling the tank compared to emptying the tank? 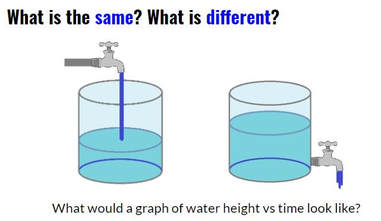 The water flowing into a tank should rise at a linear rate. Students should expect that when the water drains from an open tank, the flow will be greatest at first and then gradually decrease as the water level decreases. (This is an application of Torricelli's Law). Next we taped a measuring tape to the side of the bottle and collected some data as the water flowed out of the bottle (A similar experiment is described in Canavan-McGrath, Foundations of Mathematics 12, 429). We used the stopwatch on my cell phone to record the time at each centimeter of height. This wasn't as accurate as I had hoped due to some distractions in the room. We set up the experiment again and the second time I recorded the water falling using a video (I used the CoachMyVideo app). We were able to get much more accurate values this way.
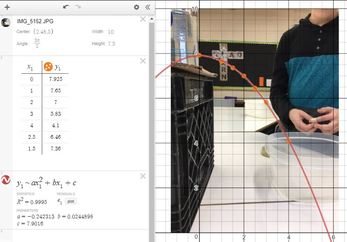
We entered the data in a table on Desmos and then did a quadratic regression to fit a curve to our points. I was a bit surprised at how well the data from the video analysis on our second attempt fit to a quadratic curve (R^2 = 0.9999.  I really liked how we could use the exact same setup to investigate two different quadratic relationships. Nova Scotia Mathematics Curriculum Outcomes Mathematics 11 RF02 - Demonstrate an understanding of the characteristics of quadratic functions, including: vertex, intercepts, domain and range and the axis of symmetry. Pre-calculus 11 RF04 - Students will be expected to analyze quadratic functions of the form y = ax^2 + bx + c to identify characteristics of the corresponding graph, including vertex, domain and range, direction of opening, axis of symmetry, x-intercept and y-intercept, and to solve problems. EL
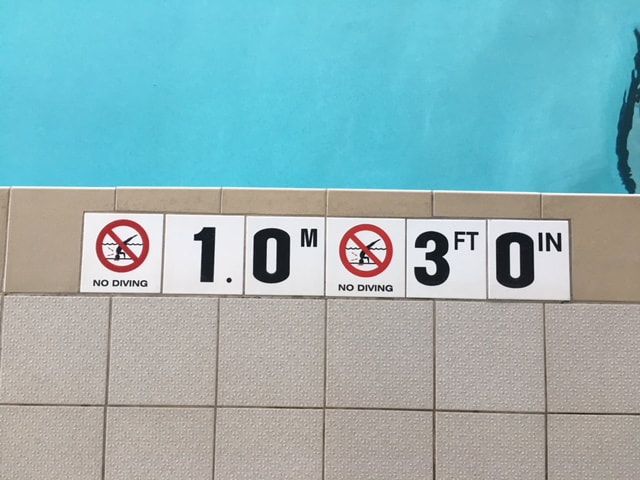
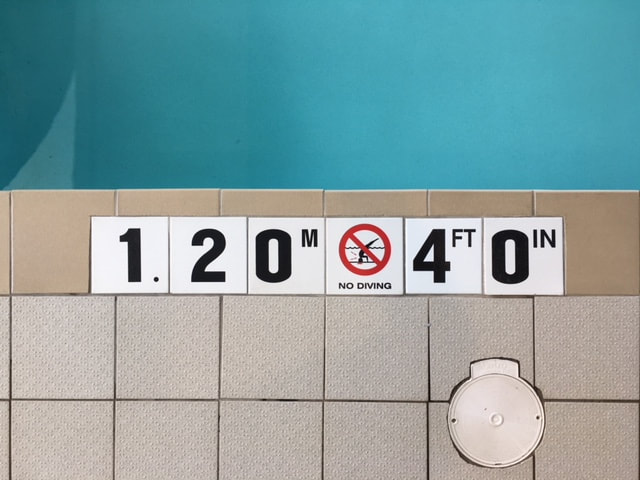
Swimming in the hotel pool I saw these depth markers. As a math teacher, they made me a bit uneasy. What do you notice in the photos below? What do you wonder?
Just look at those significant digits. They look so precise. I first thought... going from the shallow end to the deep end, it gets 1 foot / 0.2 metres deeper. That must mean that 1 ft = 0.2 m right? But then if 1 ft is 0.2 m then shouldn't 3 ft in the shallow end be 0.6 m instead of 1.0 m? So I looked at it another way... 1 m is the same as 3 ft... So 1 ft must be about 0.33 m. Which would make 4 ft equal to about 1.33 m not the 1.2 m as shown. But I know that a meter stick is shorter than a yard stick so this is just an approximation. No problem, they just rounded off both values. Then I had a moment of doubt... in the shallow end the values are in a ratio of 1/3 and in the deep end the values are in a ratio of 4/12 which is also 1/3 so shouldn't this work out? Then I realized the errors and misconceptions in this line of thinking.
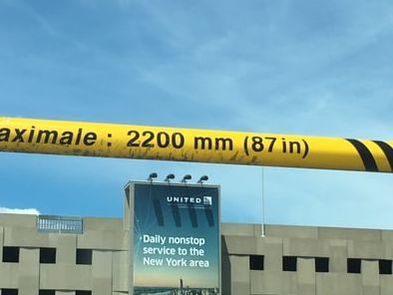
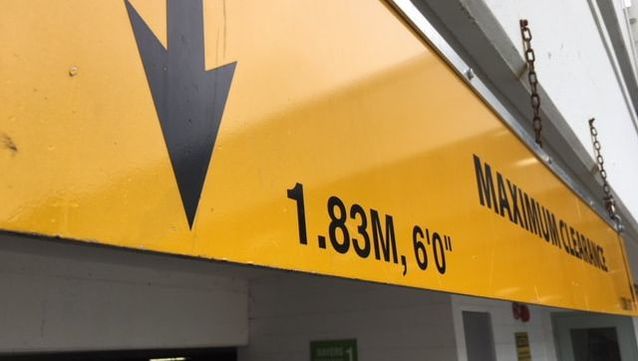
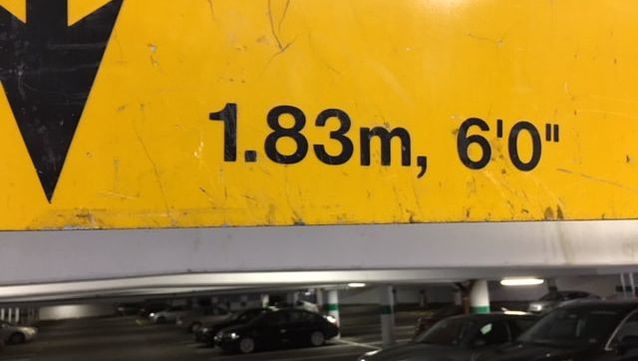
Other Linear ConversionsToday, as I was driving around, I looked more closely at the clearance signs that I passed under. There doesn't seem to be much consistency in the units used or precision. Do people with tall cars know the height of their car? I just know that I'm about 6 ft tall and my car is shorter than I am. Of course you can always just wing it. If you clear the warning bar, you're good to go. Anyway, I know for sure that my car is less than 11 foot 8 if I ever end up in North Carolina.
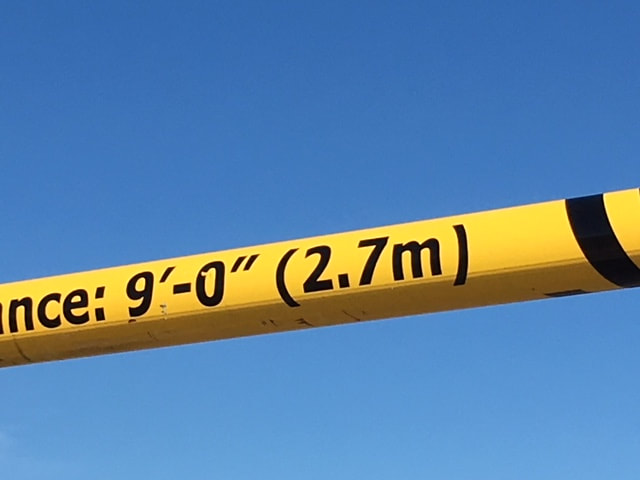
I saw this relatively accurate sign at a parking garage today so I took a photo. 6'0" is approximately 1.8288 metres so these values are the closest I've seen.
Nova Scotia Mathematics Curriculum Outcomes Mathematics 10 M02 - Students will be expected to apply proportional reasoning to problems that involve conversions between SI and imperial units of measure. Mathematics at Work 10 M01 - Students will be expected to demonstrate an understanding of the International System of Units (SI) by describing the relationships of the units for length, area, volume, capacity, mass, and temperature and applying strategies to convert SI units to imperial units. Mathematics Essentials 10 D1 - Demonstrate a working knowledge of the metric system and imperial system. EL
I recently did an activity with students to answer a question by collecting and analysing data. I was inspired by similar activities from Bruno Reddy, Mean Paper Aeroplanes, and Julie Reulbach, Paper Airplanes for Measures of Central Tendencies. We started class by watching a video of the Paper Airplane World Championship - Red Bull Paper Wings 2015. This short video (about 3 minutes) shows the highlights of three paper airplane competitions; Distance, Airtime, and Aerobatics. After watching the video I let students know that we would be making paper airplanes for a distance competition. Brainstorming
PredictionsNext I showed students two different paper airplane designs; the Suzanne and the Classic Dart. I asked students to predict which would fly the farthest. I also asked how much difference, if any, they expected to see between the two designs. Most students predicted that the Suzanne would fly farthest. The next step was to create an experiment in order to test our predictions. 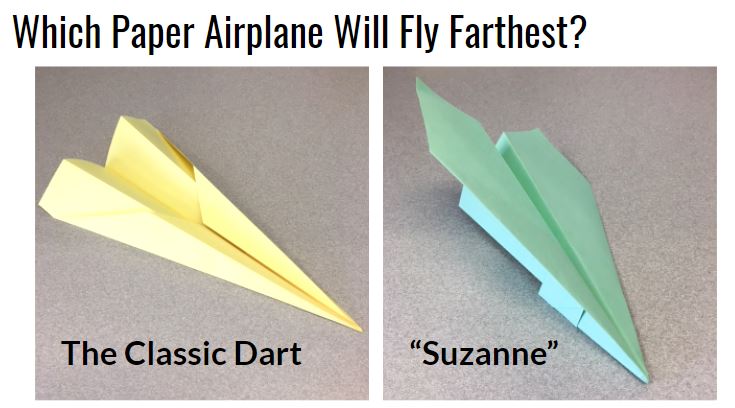 The ExperimentWe split the class in half. Each half followed a specific set of instructions to fold one or the other of these planes (I had a handout with instructions for each design). We used different coloured paper for each design. Each student threw their plane three times and recorded each flight distance. We measured in feet since the floor tiles in the hallway were one square foot. The students then calculated their mean distance and shared this mean with their team. Each team then calculated a five number summary and sketched a box plot for their data. The ResultsStudents declared the Suzanne to be the clear winner. The low ceiling height in the hallway seems to have favoured the glider design. We conjectured that the Dart may have performed better than Suzanne if they were thrown outdoors where students could throw at a higher launch angle. We also conjectured that the greater variation in the data for Suzanne was a result of the more complex folding required. Some planes were folded very well and others were a bit of a mess. 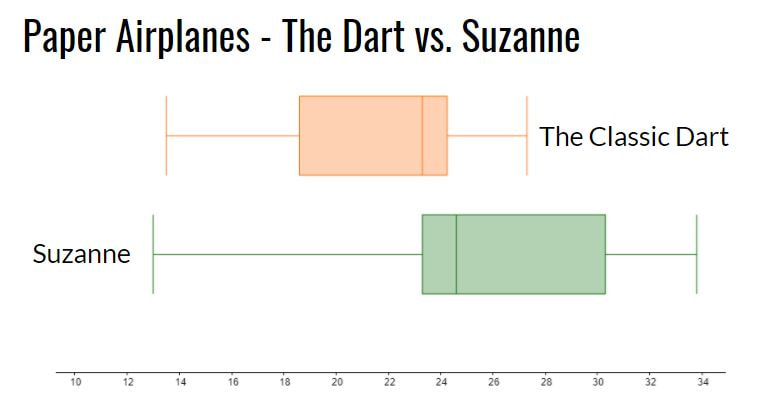 Reflection
We finished class by watching a video of the world record throw for distance (we just watched the first 3 minutes of the video). The Suzanne, designed by John Collins and thrown by football quarterback Joe Ayoob holds the Guinness World Record for the farthest flight by a paper aircraft. The record throw was 226 feet, 10 inches (approx. 69.14 m). Our longest flight was just over 40 feet. Students seemed to really enjoy this activity. It allowed them to incorporate some movement in class and asked them to use mathematics and statistics in an authentic way to answer a real question. Update 26 April 2022 - Looks like there may be a new world record paper airplane throw. An attempt from April 16, 2022 went 77.134m! https://www.youtube.com/watch?v=7Mdgta-0dtE Nova Scotia Mathematics Curriculum Outcomes Extended Mathematics 11 S01 - Analyze, interpret, and draw conclusions from one-variable data using numerical and graphical summaries. Mathematics 9 SP03 - Students will be expected to develop and implement a project plan for the collection, display, and analysis of data by: formulating a question for investigation; choosing a data collection method that includes social considerations; selecting a population or a sample; collecting the data; displaying the collected data in an appropriate manner; drawing conclusions to answer the question. EL
|
Categories
All
|
 RSS Feed