|
I was recently invited by a class to work with them on collecting and analysing data. After brainstorming some ideas with the classroom teacher, we settled on collecting data from pull back cars. I checked out Fawn Nguyen's Vroom Vroom lesson and Simon Job's Car Racing lesson to get some ideas on how to organize this lesson. We started the lesson by sharing the first half of Simon's video of cars racing across the floor. We had the students do some notice and wonder about the action taking place in the video and then introduced activity.
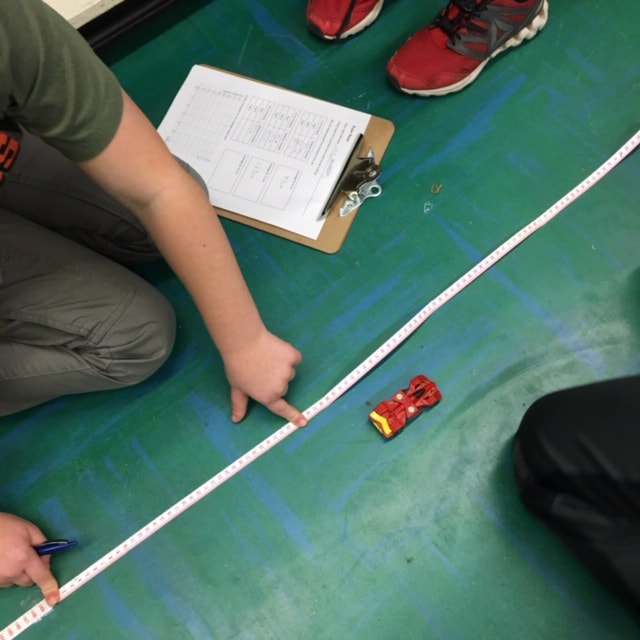
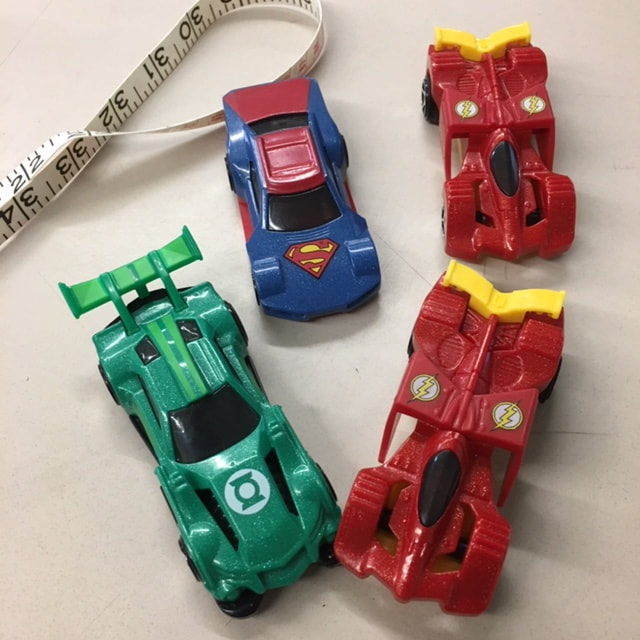
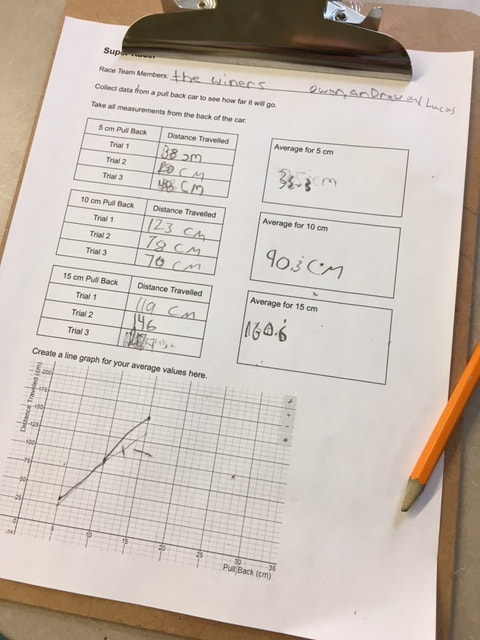
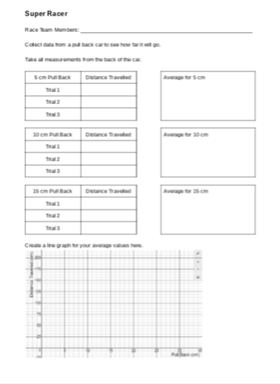
We showed students the recording sheet that we would be using and how we would be taking measurements (A link to the record sheet Google Doc is here). Then we brainstormed some ways to make sure that we all collected good data and avoided errors: we would all use the same units (centimeters), all measure our distances the same way (from the front bumper), not use data if the car bumped into a wall or a desk, etc. We split up into racing teams of three students each. Each group got a measuring tape, a pull back car and a recording sheet on a clip board.
The classroom teacher and I circulated the room (and a bit of the hallway) to help students and answer questions. After students finished collecting their data and plotting their values we came back together as a class. We asked several groups to plot their data on the whiteboard at the front of the room. We then had a discussion about general trends as well as why each car had a slightly different graph. Cars might have different wind up springs, different tire grip, dusty floors, aerodynamics, etc. 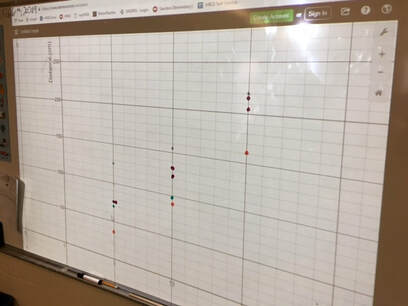 We finished the class with a bit of excitement... the 150 Challenge. Each team had to use the data for their car to predict how much they would need to pull back to make the car travel as close to 150 cm as possible. Teams huddled to interpret their data and select a pull back distance. Each team brought their car to the front of the class to give it their best shot. There was lots of cheering and excitement as some teams got very close. The winning distance was only 2.5 cm! Much closer than I had expected. This activity could be easily extended for higher grade levels by incorporating linear relationships, linear equations and linear regression. Nova Scotia Mathematics Curriculum Outcomes Mathematics 6 SP01 - Students will be expected to create, label, and interpret line graphs to draw conclusions. Mathematics 6 SP02 - Students will be expected to select, justify, and use appropriate methods of collecting data, including questionnaires, experiments, databases, and electronic media. Mathematics 6 SP03 - Students will be expected to graph collected data and analyze the graph to solve problems. Mathematics 9 PR02 - Students will be expected to graph a linear relation, analyze the graph, and interpolate or extrapolate to solve problems. Mathematics 10 RF07 - Determine the equation of a linear relation, given: a graph, a point and the slope, two points and a point and the equation of a parallel or perpendicular line to solve problems. (including RF07.06 Determine the equation of the line of best fit from a scatterplot using technology and determine the correlation) Mathematics Extended 11 S01 - Analyze, interpret, and draw conclusions from one-variable data using numerical and graphical summaries. EL
Comments are closed.
|
Categories
All
|
 RSS Feed