|
Investigations where students discover the relationship between variables can help students build a deeper understanding of functions. Often these explorations are hands on and engaging lessons. They typically start with some sort of interesting video or question prompt such as "What makes for an exciting bungee jump?" or "Which cup will keep my coffee warm the longest?". I was prompted to think about my favourite investigations after seeing a post from Nat Banting on Twitter. Below are a collection of links and descriptions of my favourite secondary mathematics investigations. Linear Relationships
Quadratic Relationships
Exponential Relationships
I like the investigation above because they share several common features.
Do you have a favourite activity or resource for activities? Please let me know what it is. EL
I was recently looking for an activity to explore a linear relationship, preferable one that included some practice with decimals. I found a few examples but none of them really seemed to satisfy what I was looking for. Here are a few of my criteria for good experiments to explore function relationships:
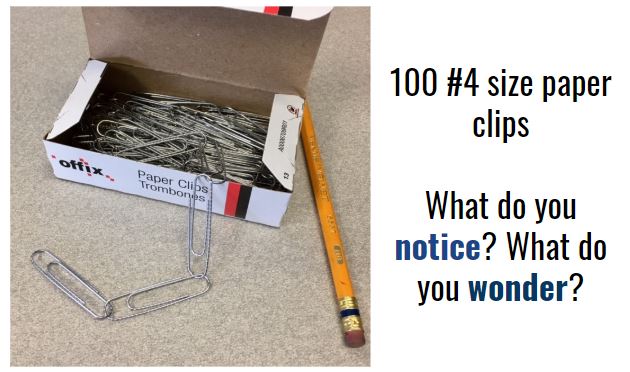
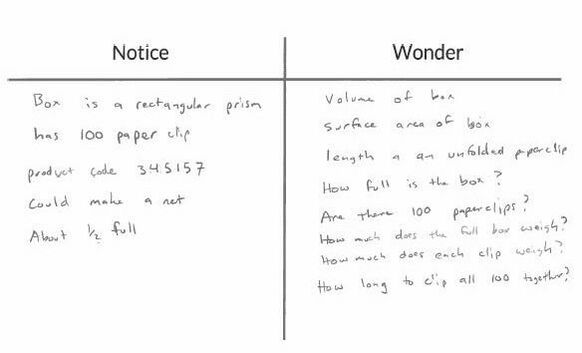
Notice and Wonder
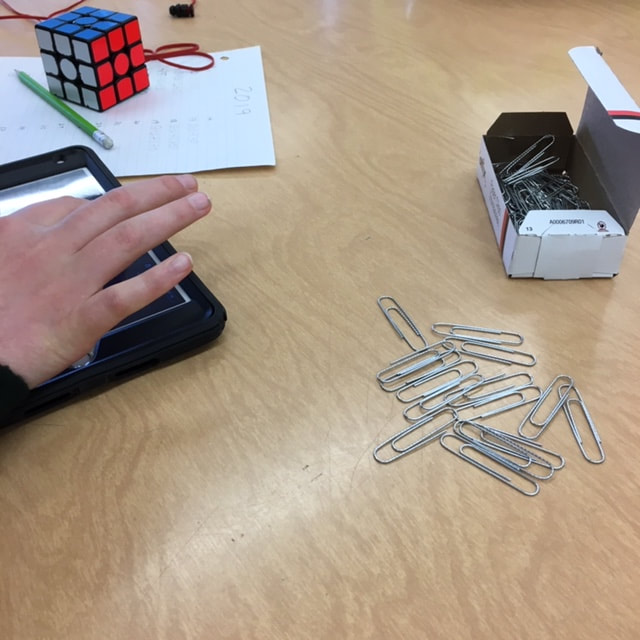
There were some great questions about volume and surface area, weight, and size of the paper clips (what is a #4 sized paper clip?). The questions the we went on to investigate was how long would it take to make a paper clip chain from all 100 paper clips. I was inspired by Dan Meyer's Guinness World Record for the longest paperclip chain in 24 hours. Dan blogged about breaking the record as well as asking student to see how many paperclips they could chain in one minute. Estimation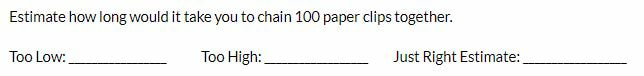 I asked students to estimate how long they thought it would take to create a chain of 100 paper clips. I also asked them to think about an estimate that they know was too low (that creating a chain this fast was not possible) and too high (that they would have no problem creating a chain in this time even going slowly). Most students thought that a time between 5 and 6 minutes was a good "just right" estimate. Gathering Data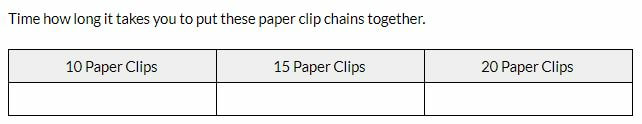
Revising EstimatesAfter collecting and analyzing some data, I ask students if they'd like to revise their estimate for 100 paper clips. Then we test their revised estimate using a plot of the values they collected and extrapolating. Below is one student's data plotted in Desmos. They estimated 300 seconds (5 minutes) to chain all 100 paperclips. 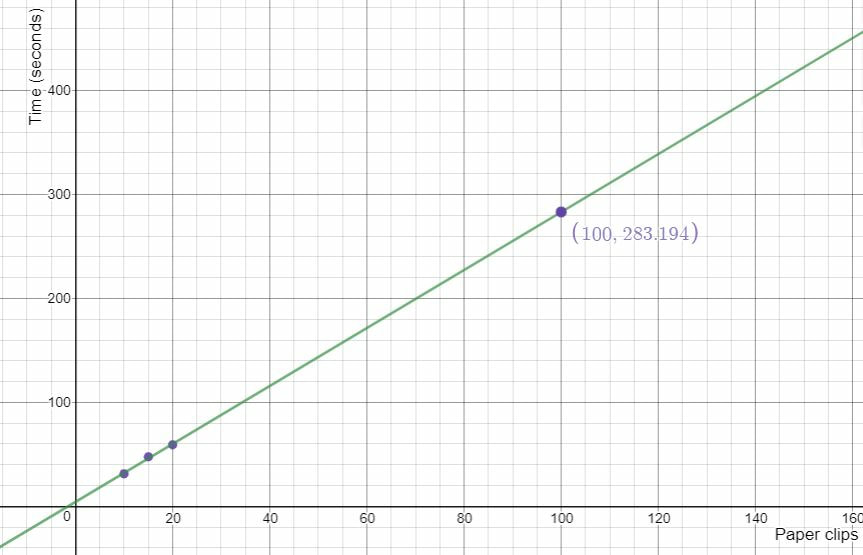 This lesson could be modified to include outcomes from a number of different grade levels. I closed the lesson by showing students the record for the most paper clips linked together in one minute and asked students how they would compare. Nova Scotia Mathematics Curriculum Outcomes Mathematics 6 SP01 - Students will be expected to create, label, and interpret line graphs to draw conclusions. Mathematics 6 SP02 - Students will be expected to select, justify, and use appropriate methods of collecting data, including questionnaires, experiments, databases, and electronic media. Mathematics 6 SP03 - Students will be expected to graph collected data and analyze the graph to solve problems. Mathematics 7 PR02 - Students will be expected to create a table of values from a linear relation, graph the table of values, and analyze the graph to draw conclusions and solve problems. Mathematics 7 N02 - Students will be expected to demonstrate an understanding of the addition, subtraction, multiplication and division of decimals to solve problems (for more than one-digit divisors or more than two-digit multipliers, the use of technology is expected). Mathematics 7 SP01 - Students will be expected to demonstrate an understanding of central tendency and range by: determining the measures of central tendency (mean, median, mode) and range; determining the most appropriate measures of central tendency to report findings. Mathematics 7 SP02 - Students will be expected to determine the effect on the mean, median, and mode when an outlier is included in a data set. EL
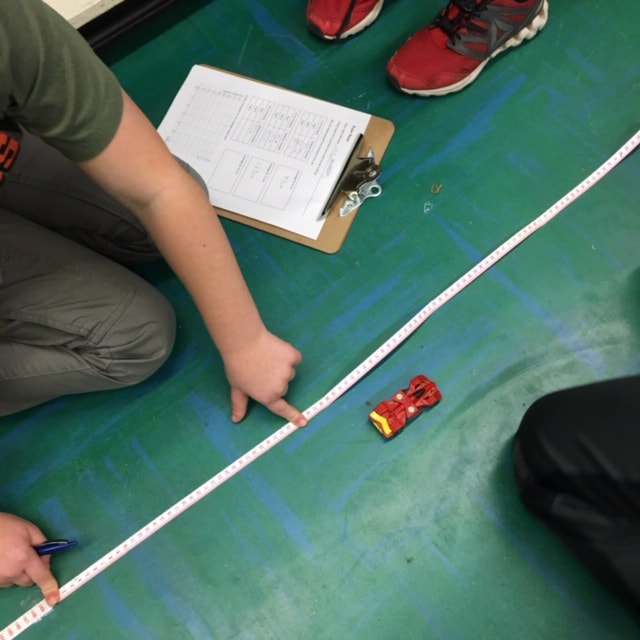
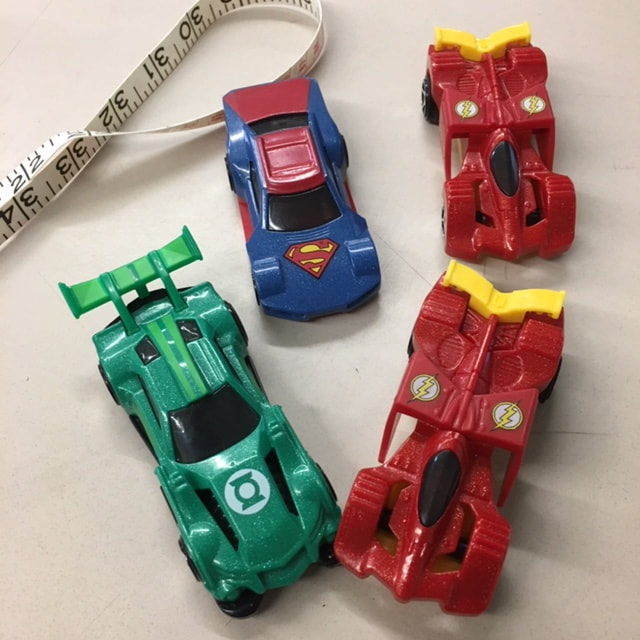
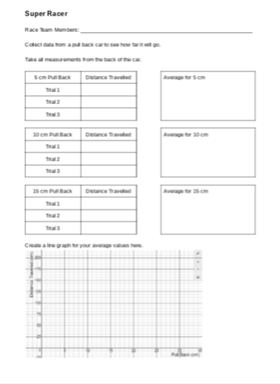
I was recently invited by a class to work with them on collecting and analysing data. After brainstorming some ideas with the classroom teacher, we settled on collecting data from pull back cars. I checked out Fawn Nguyen's Vroom Vroom lesson and Simon Job's Car Racing lesson to get some ideas on how to organize this lesson. We started the lesson by sharing the first half of Simon's video of cars racing across the floor. We had the students do some notice and wonder about the action taking place in the video and then introduced activity.
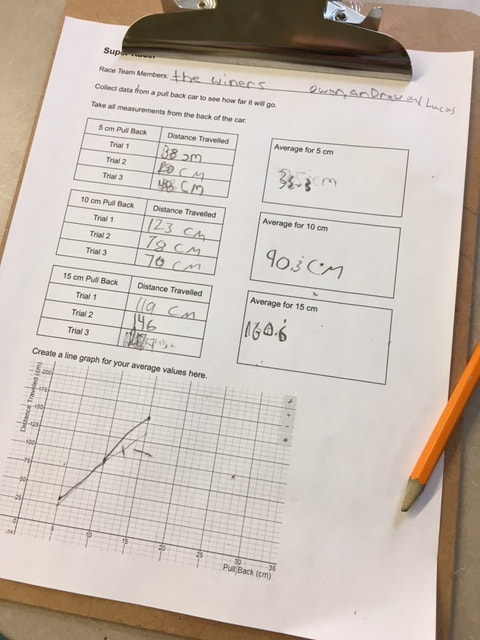
We showed students the recording sheet that we would be using and how we would be taking measurements (A link to the record sheet Google Doc is here). Then we brainstormed some ways to make sure that we all collected good data and avoided errors: we would all use the same units (centimeters), all measure our distances the same way (from the front bumper), not use data if the car bumped into a wall or a desk, etc. We split up into racing teams of three students each. Each group got a measuring tape, a pull back car and a recording sheet on a clip board.
The classroom teacher and I circulated the room (and a bit of the hallway) to help students and answer questions. After students finished collecting their data and plotting their values we came back together as a class. We asked several groups to plot their data on the whiteboard at the front of the room. We then had a discussion about general trends as well as why each car had a slightly different graph. Cars might have different wind up springs, different tire grip, dusty floors, aerodynamics, etc.  We finished the class with a bit of excitement... the 150 Challenge. Each team had to use the data for their car to predict how much they would need to pull back to make the car travel as close to 150 cm as possible. Teams huddled to interpret their data and select a pull back distance. Each team brought their car to the front of the class to give it their best shot. There was lots of cheering and excitement as some teams got very close. The winning distance was only 2.5 cm! Much closer than I had expected. This activity could be easily extended for higher grade levels by incorporating linear relationships, linear equations and linear regression. Nova Scotia Mathematics Curriculum Outcomes Mathematics 6 SP01 - Students will be expected to create, label, and interpret line graphs to draw conclusions. Mathematics 6 SP02 - Students will be expected to select, justify, and use appropriate methods of collecting data, including questionnaires, experiments, databases, and electronic media. Mathematics 6 SP03 - Students will be expected to graph collected data and analyze the graph to solve problems. Mathematics 9 PR02 - Students will be expected to graph a linear relation, analyze the graph, and interpolate or extrapolate to solve problems. Mathematics 10 RF07 - Determine the equation of a linear relation, given: a graph, a point and the slope, two points and a point and the equation of a parallel or perpendicular line to solve problems. (including RF07.06 Determine the equation of the line of best fit from a scatterplot using technology and determine the correlation) Mathematics Extended 11 S01 - Analyze, interpret, and draw conclusions from one-variable data using numerical and graphical summaries. EL
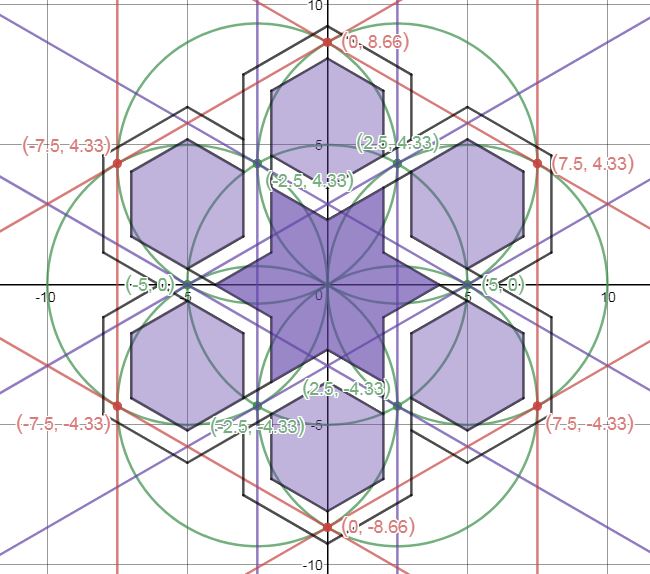
About a year ago, I signed up for Samira Mian's Udemy course on Islamic Geometry. I also purchased a copy of Eric Broug's book Islamic Geometric Patterns. I wanted to learn the basics so that I could determine if this might be a good way to satisfy the grade 7 mathematics geometric constructions outcome. I designed a short unit that I described last year. Recently, I decided to try replicating some of these patterns using the online Desmos calculator and geometry tool. I think having some experience drawing these patterns with a compass and straight edge was helpful. If you're looking for some Islamic geometric patterns to try, YouTube is a great place to get some ideas. There are some great instructional videos from Samira Mian and Nora Youssef, among others. The first pattern that I tried was a Star and Hexagon pattern that I learned from Samira's Udemy course. I learned that sticking with exact values are worth the effort. Rounding intersection points and slopes of lines to the nearest tenths or hundredths place work well at first but the errors compound and things start to get messy down the road. Interlacing the pattern gave me lots of practice with domain and range restrictions. 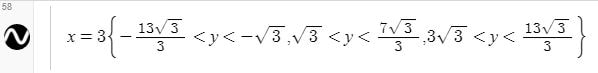
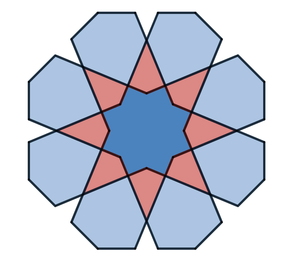
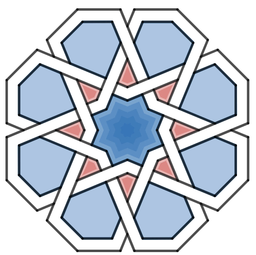
8 Fold RosetteNora Youssef has a nice video tutorial on for drawing an 8-Fold Rosette pattern. I did this pattern twice. The first time I constructed the basic pattern and the second time I added interlacing. I used the polygon function to add colour and figured out how to use trigonometry to rotate the polygons around the origin. This made it really efficient. I created a table with the vertices of the polygon and then just duplicated and rotated that polygon around the rosette. I duplicated the polygons multiple times to make the colours bold. 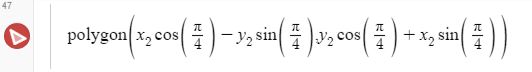
Links:
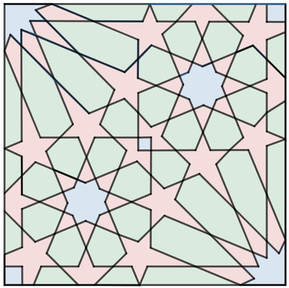
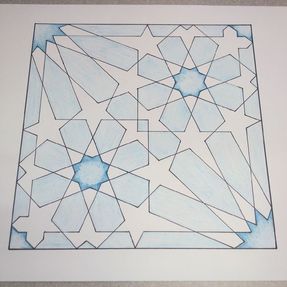
Mathy MomentsYou can see from my notebook below that some of the math took me a few tries (this goes on for several pages). To make the weave for the 8 fold rosette, I made lines parallel to the original with a distance of 0.5 above and below. Each ribbon was then 1 unit wide. I was working with the equations in point-slope form. I'm pretty sure that there are more efficient ways to do these calculations but I haven't discovered them yet. I really like how these messy bits encourage me look for more efficient and elegant methods. 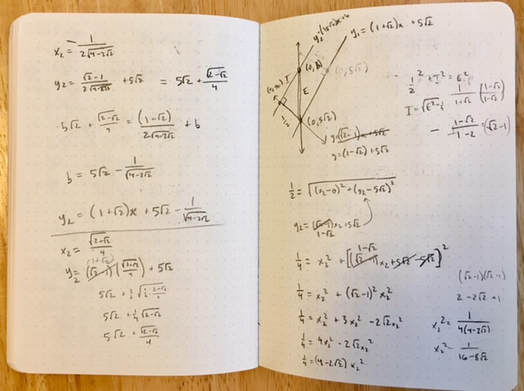 Desmos Geometry ToolAfter working with the Desmos calculator for a while, I wanted to give the geometry tool a try. I decided to try a pattern that I saw on the Pattern In Islamic Art website. This site has some great resources. The pattern that I tried was from David Wade's book Pattern in Islamic Art. The geometry tool requires much less algebraic manipulation, but I find hiding the underlying grid is much more tedious than in the calculator. Everything has to be hidden individually instead of turning a whole folder on or off in the calculator. I've drawn this pattern in the past by hand and it would have been much more difficult if I didn't have that previous experience.
Future ProjectsI've tried tiling some designs to cover the plane but I haven't come up with any good methods for this yet. I've also tried using sliders to dynamically adjust some of the relationships between the sizes of the pieces in these designs. These are great challenges and are helping me learn new features of Desmos. Dan Meyer wrote "If Math Is The Aspirin, Then How Do You Create The Headache?" I hesitate to call these graphing projects "headaches" because I enjoy the challenge. Regardless, this is a case where my need for mathematical solutions guide my learning and give me reasons to explore new graphing methods. EL
I recently visited Memory Lane Heritage Village in Lake Charlotte. It is a living history museum depicting coastal rural life in Nova Scotia during the 1940s. My five year old son had a great time. He especially enjoyed sitting in the 1928 Ford Model A car and pretending to drive. On the way back home I was thinking about other living history museums in Nova Scotia and realized that, based on my experience, it appears that the further away from my home in Halifax that I drive, the farther back in time the museums depict. When I got home, I dug up some data. Sherbrooke Village depicts a typical Nova Scotian village from the 1860s and the Fortress of Louisbourg allows you to experience life in Louisbourg during the 1740s. 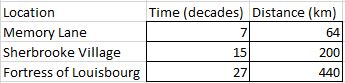 I used Google Maps to find the driving distance from my house to each of these locations and discovered a nearly perfect linear relationship. How perfect you ask? The correlation coefficient was 0.99906. I quickly created a scatter plot with a line of best fit to show my wife. Despite my exuberance, she appeared to remain unimpressed. 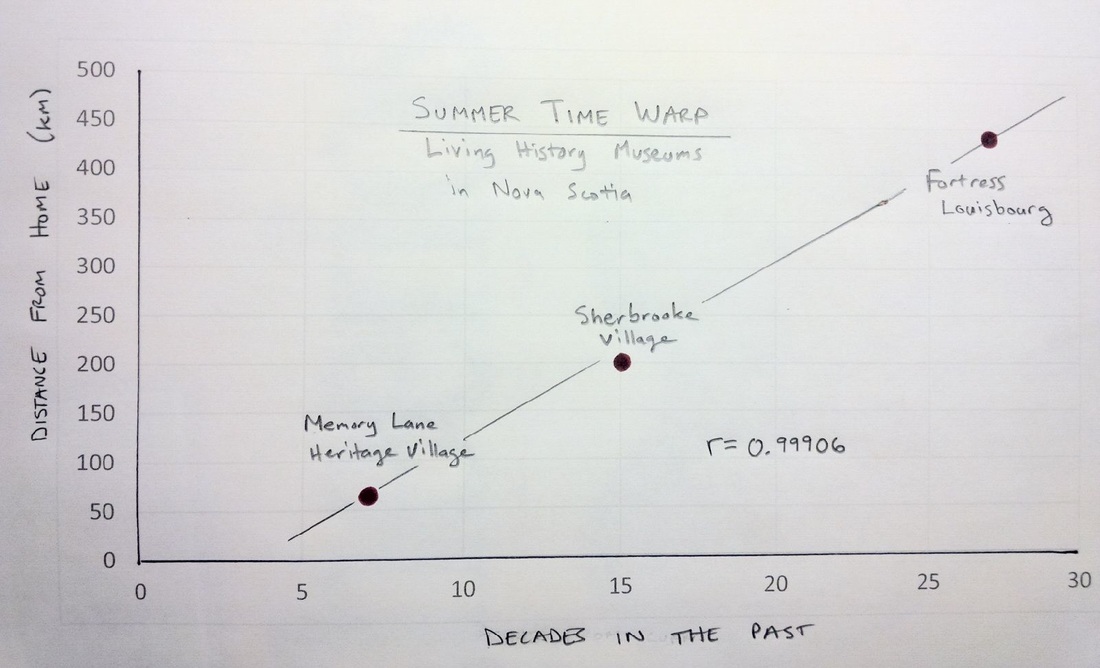 It is also interesting to see that the points on the scatter plot are almost exactly where the sites are on a map of Nova Scotia as well. Mind Blown. 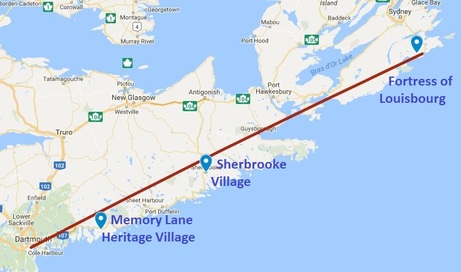 A question that I still have is whether this apparent temporal relationship is based on distance or displacement. Perhaps I need to collect some additional data (or not intentionally disregard data that doesn't fit my hypothesis)? If I travel in the opposite direction, should a living history museum depict life in the past or in the future? I'd love to visit Yarmouth some day to experience what life will be like in rural Nova Scotia in the year 2213! EL
|
Categories
All
|

 RSS Feed