|
Below is a simple probability game that I've played with students for many years in a number of different courses. I don't really remember where I got it from but if you've seen it before, I'd love to know where it originated. I've found that students enjoy it and they really develop some good ideas about probability. Its similar to the Two-Dice Sum Game from Marilyn Burns but with some additional mental math for older students. InstructionsThis is a game for two or more players. Each player creates their own score card by drawing two concentric circles and then divide it into eight sectors. Choose eight different numbers between 2 and 12 and place them in the sectors in the outer ring. In the inner ring of the circle place numbers that add up to 100 (it is easiest to stick with multiples of 5). Roll two dice and add the numbers together, if the total is one of the numbers in the outer ring of your score card, you score that numbers value (the number in the inner ring). Players alternate rolling and scoring on their card until one of the players has 150 or more points (or to 100 for a bit shorter game). A google doc handout for this is available here. Sample Score Card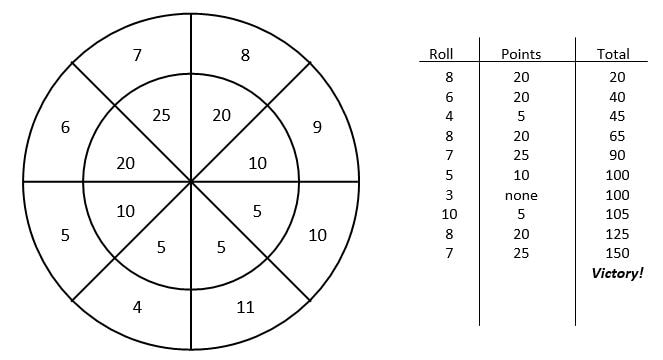 Typically, the first time students play, they will randomly select numbers and values for each sector. After students have had the chance to play a few games, stop and ask them to look at different score cards to see if there any common characteristics of winning cards. What makes a good score card? Is it all just luck or are some cards better than others? Developing a StrategyWhat makes a good score card? Here are some common student observations:
Experimental ProbabilityYou might ask students to roll two dice a bunch of times and record which numbers come up each time. Create a bit dot plot or a bar graph at the front of the classroom using all of this data. Ask students to predict what the shape of this graph will be. You could also use an online tool to model lots of dice rolls to see how it compares to the class data. You could then discuss the theoretical probability for each sum and compare it to the data you gathered. I always find this a fun activity and a nice way to start a discussion about probability and strategy. A nice question to start the class on the following day would be a Would You Rather? math prompt, "Would you rather flip 2 coins and win if they match OR roll 2 dice and win if they don't match?" Another great follow up activity would be Don Steward's Dice Bingo. Nova Scotia Mathematics Curriculum Outcomes Mathematics at Work 12 P01 - Students will be expected to analyze and interpret problems that involve probability. Mathematics Essentials 10 G4 - Compare predicted and experimental results for familiar situations involving chance, using technology to extend the number of experimental trials. Mathematics 8 SP02 - Students will be expected to solve problems involving the probability of independent events. Mathematics 7 SP06 - Students will be expected to conduct a probability experiment to compare the theoretical probability (determined using a tree diagram, table, or other graphic organizer) and experimental probability of two independent events. EL
|
Categories
All
|
 RSS Feed