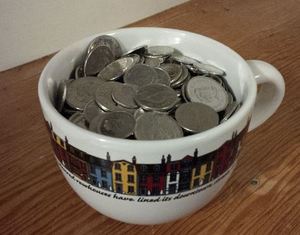
When I got home, I did a search to find out why the machines were gone and ran across a story from Global News. It turns out that TD Bank had decided to retire all the coin counting machines in Canada in the wake of reports from the U.S. that the machines were short-changing customers. In a segment on the Today Show called 'Rossen Reports', a team investigated the accuracy of a number of Coinstar machines as well as coin-counting machines at various branches of TD Bank. The team tested the accuracy of the machines by carefully preparing bags filled with exactly $300 worth of pennies, nickles, dimes and quarters. They then used the machines to see how close their count was to $300. The Coinstar machines all checked out with the correct $300 total. The TD Bank machines did not fare so well. The totals on the machines tested at 5 different branches were: $299.95, $299.47, $299.30, $296.27 and $256.90. None of the machines returned an accurate $300 count. I don't think that machines can really be "100% accurate" all the time. What level of accuracy do you think is acceptable from a coin-counting machine? How much time does it take to roll $300 worth of coins and how much is your time worth? I would probably accept $299.95 for the convenience of not having to roll that many coins. I would be a bit more hesitant to accept $296.27 and definitely would not accept $256.90. While the TD Bank machines were free for customers, in Canada, Coinstar machines apply a coin counting fee of 11.9 cents per dollar. For the $300 counted in this test, the fee would have been $35.70. That is a pretty hefty fee. Questions and EstimationsAccording to a class action lawsuit filed in New York in April 2016, TD’s coin-counting machines processed 29 billion coins in 2012. Based on this figure and the data collected by the Rossen Report, how much money do you think customers lost? What factors did you consider when making this estimate? How would you design an experiment to test the accuracy of TD's coin counting machines? Would you test lots of different machines or a few machines multiple times? How many trials would you run to be confident in your results? What factors might contribute to the errors discovered in these machines? Nova Scotia Mathematics Curriculum Outcomes Mathematics 11 S02 - Interpret statistical data, using: confidence intervals, confidence levels and margin of error. Mathematics 11 S03 - Critically analyze society’s use of statistics. Grade 9 SP03 - Students will be expected to develop and implement a project plan for the collection, display, and analysis of data by: formulating a question for investigation; choosing a data collection method that includes social considerations; selecting a population or a sample; collecting the data; displaying the collected data in an appropriate manner; drawing conclusions to answer the question. Grade 7 SP06 - Students will be expected to conduct a probability experiment to compare the theoretical probability (determined using a tree diagram, table, or other graphic organizer) and experimental probability of two independent events. EL
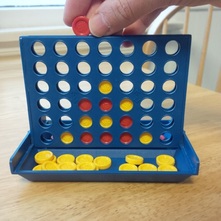
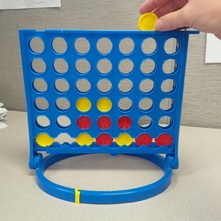
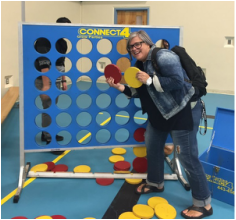
Scale is a concept that is found at numerous grade levels in the Nova Scotia Mathematics curriculum. Scale drawings and models, similar polygons, and proportions are all found in mathematics outcomes. In math, scale is the ratio of the length in an image (or model) to the length of the actual object. Below is a question relating to scale factors. A scale factor is the ratio of any two corresponding lengths in two similar geometric figures. Take a look at the three different versions of Connect Four. Estimate the scale factor between each pair of game boards from the given pictures. Estimate the radius of each of the coloured chips. Is the scale factor of the radius of each coloured chip the same as the scale factor of their volume?
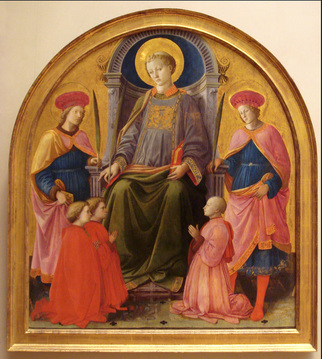
You might ask students how scale is different from proportion. Try out this question: How big would a game board of Connect Four Hundred be (or even Connect Four Million) compared to Connect Four?  In visual arts, scale refers to the size ratio between objects within an image. Using a consistent scale will make a drawing look more realistic. Objects do not appear too large or too small when compared to each other. Sometimes however, an artist might intentionally change the scale of certain objects in an image. One such technique is called 'Hieratic scale' or sometimes 'Hierarchical proportion'. This technique can be seen in paintings and sculpture from the middle ages where powerful or holy people were sometimes painted larger than ordinary or less important people to show their relative importance. The larger a person was, the greater their importance.
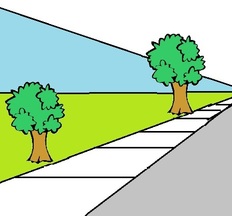
It would be fun to show students examples of how visual artists play with scale in order to make an impact on the viewer. Students might even be given an opportunity to create a piece of art that has an exaggerated or inconsistent scale or plays with forced perspective. Nova Scotia Mathematics Curriculum Outcomes Grade 6 N05 - Students will be expected to demonstrate an understanding of ratio, concretely, pictorially, and symbolically. Grade 8 N04 - Students will be expected to demonstrate an understanding of ratio and rate. Grade 8 N05 - Students will be expected to solve problems that involve rates, ratios, and proportional reasoning. Grade 9 G03 - Students will be expected to draw and interpret scale diagrams of 2-D shapes. Math at Work 10 G03 - Students will be expected to demonstrate an understanding of similarity of convex polygons, including regular and irregular polygons. Mathematics Essentials 11 D9 - calculate scale factors in 2-D scale diagrams and 3-D scale models understand the relationship among the scale factor and the related change in area or volume.Math at Work 11 G02 - Students will be expected to solve problems that involve scale. Mathematics 11 M03 - Demonstrate an understanding of the relationships among scale factors, areas, surface areas and volumes of similar 2-D shapes and 3-D objects. EL
|
Categories
All
|
 RSS Feed